 Research79
Descriptive statistics for every variable, missing values found and handled, outliers found and handled, reverse items found and rescored, Likert scale scores, Cronbach’s α computed, binned variables, normality checked from skewness and kurtosis, correlation, independent-samples t-tests, regression, APA tables generated, manuscript-ready sentences, your results explained in plain language, and copying the tables and sentences out — all in one flow.
Easily preprocess survey data, run statistical analysis, and write paper-ready tables and sentences
Survey done, but stuck on the analysis? Work through it step by step, from choosing a test to interpreting your results.
With this many tables and charts, a wide screen (PC) reads better
Analysis that used to take days or weeks, finished with paper-ready results before your deadline.
Taken classes, tried AI, and read the books, but still stuck? Follow the on-screen guide and analyze your data quickly and easily, with just a few clicks.
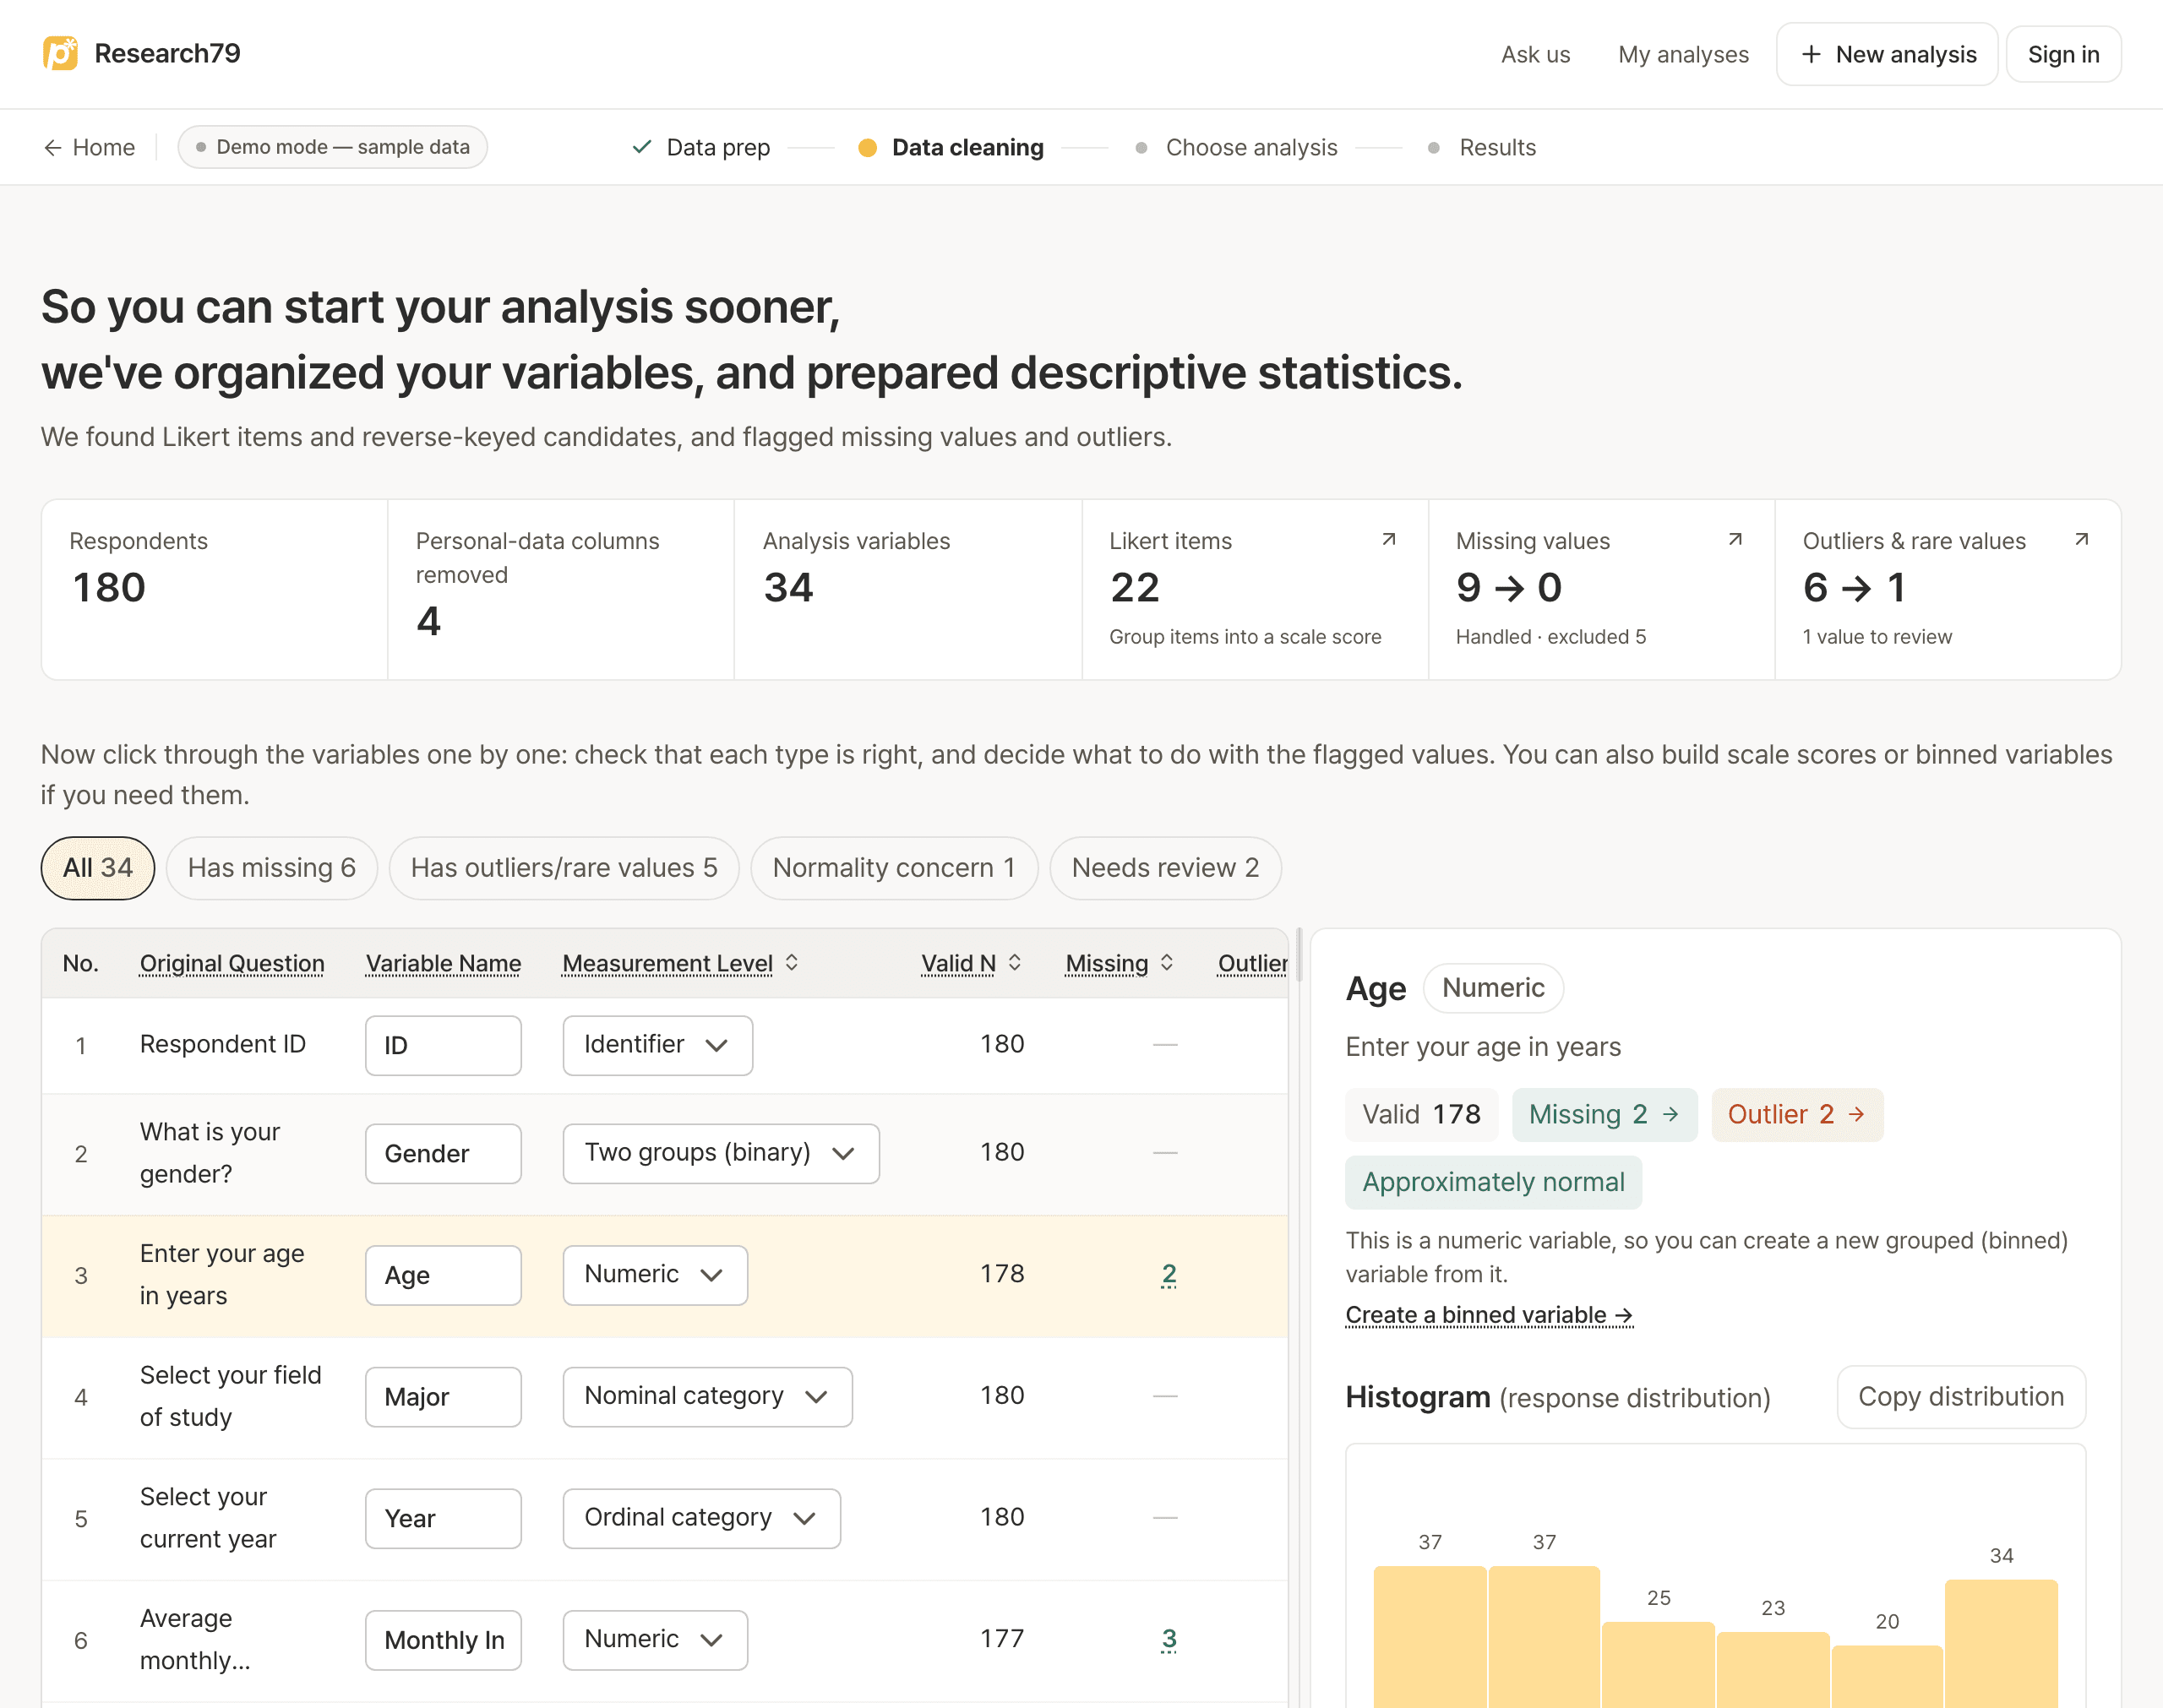
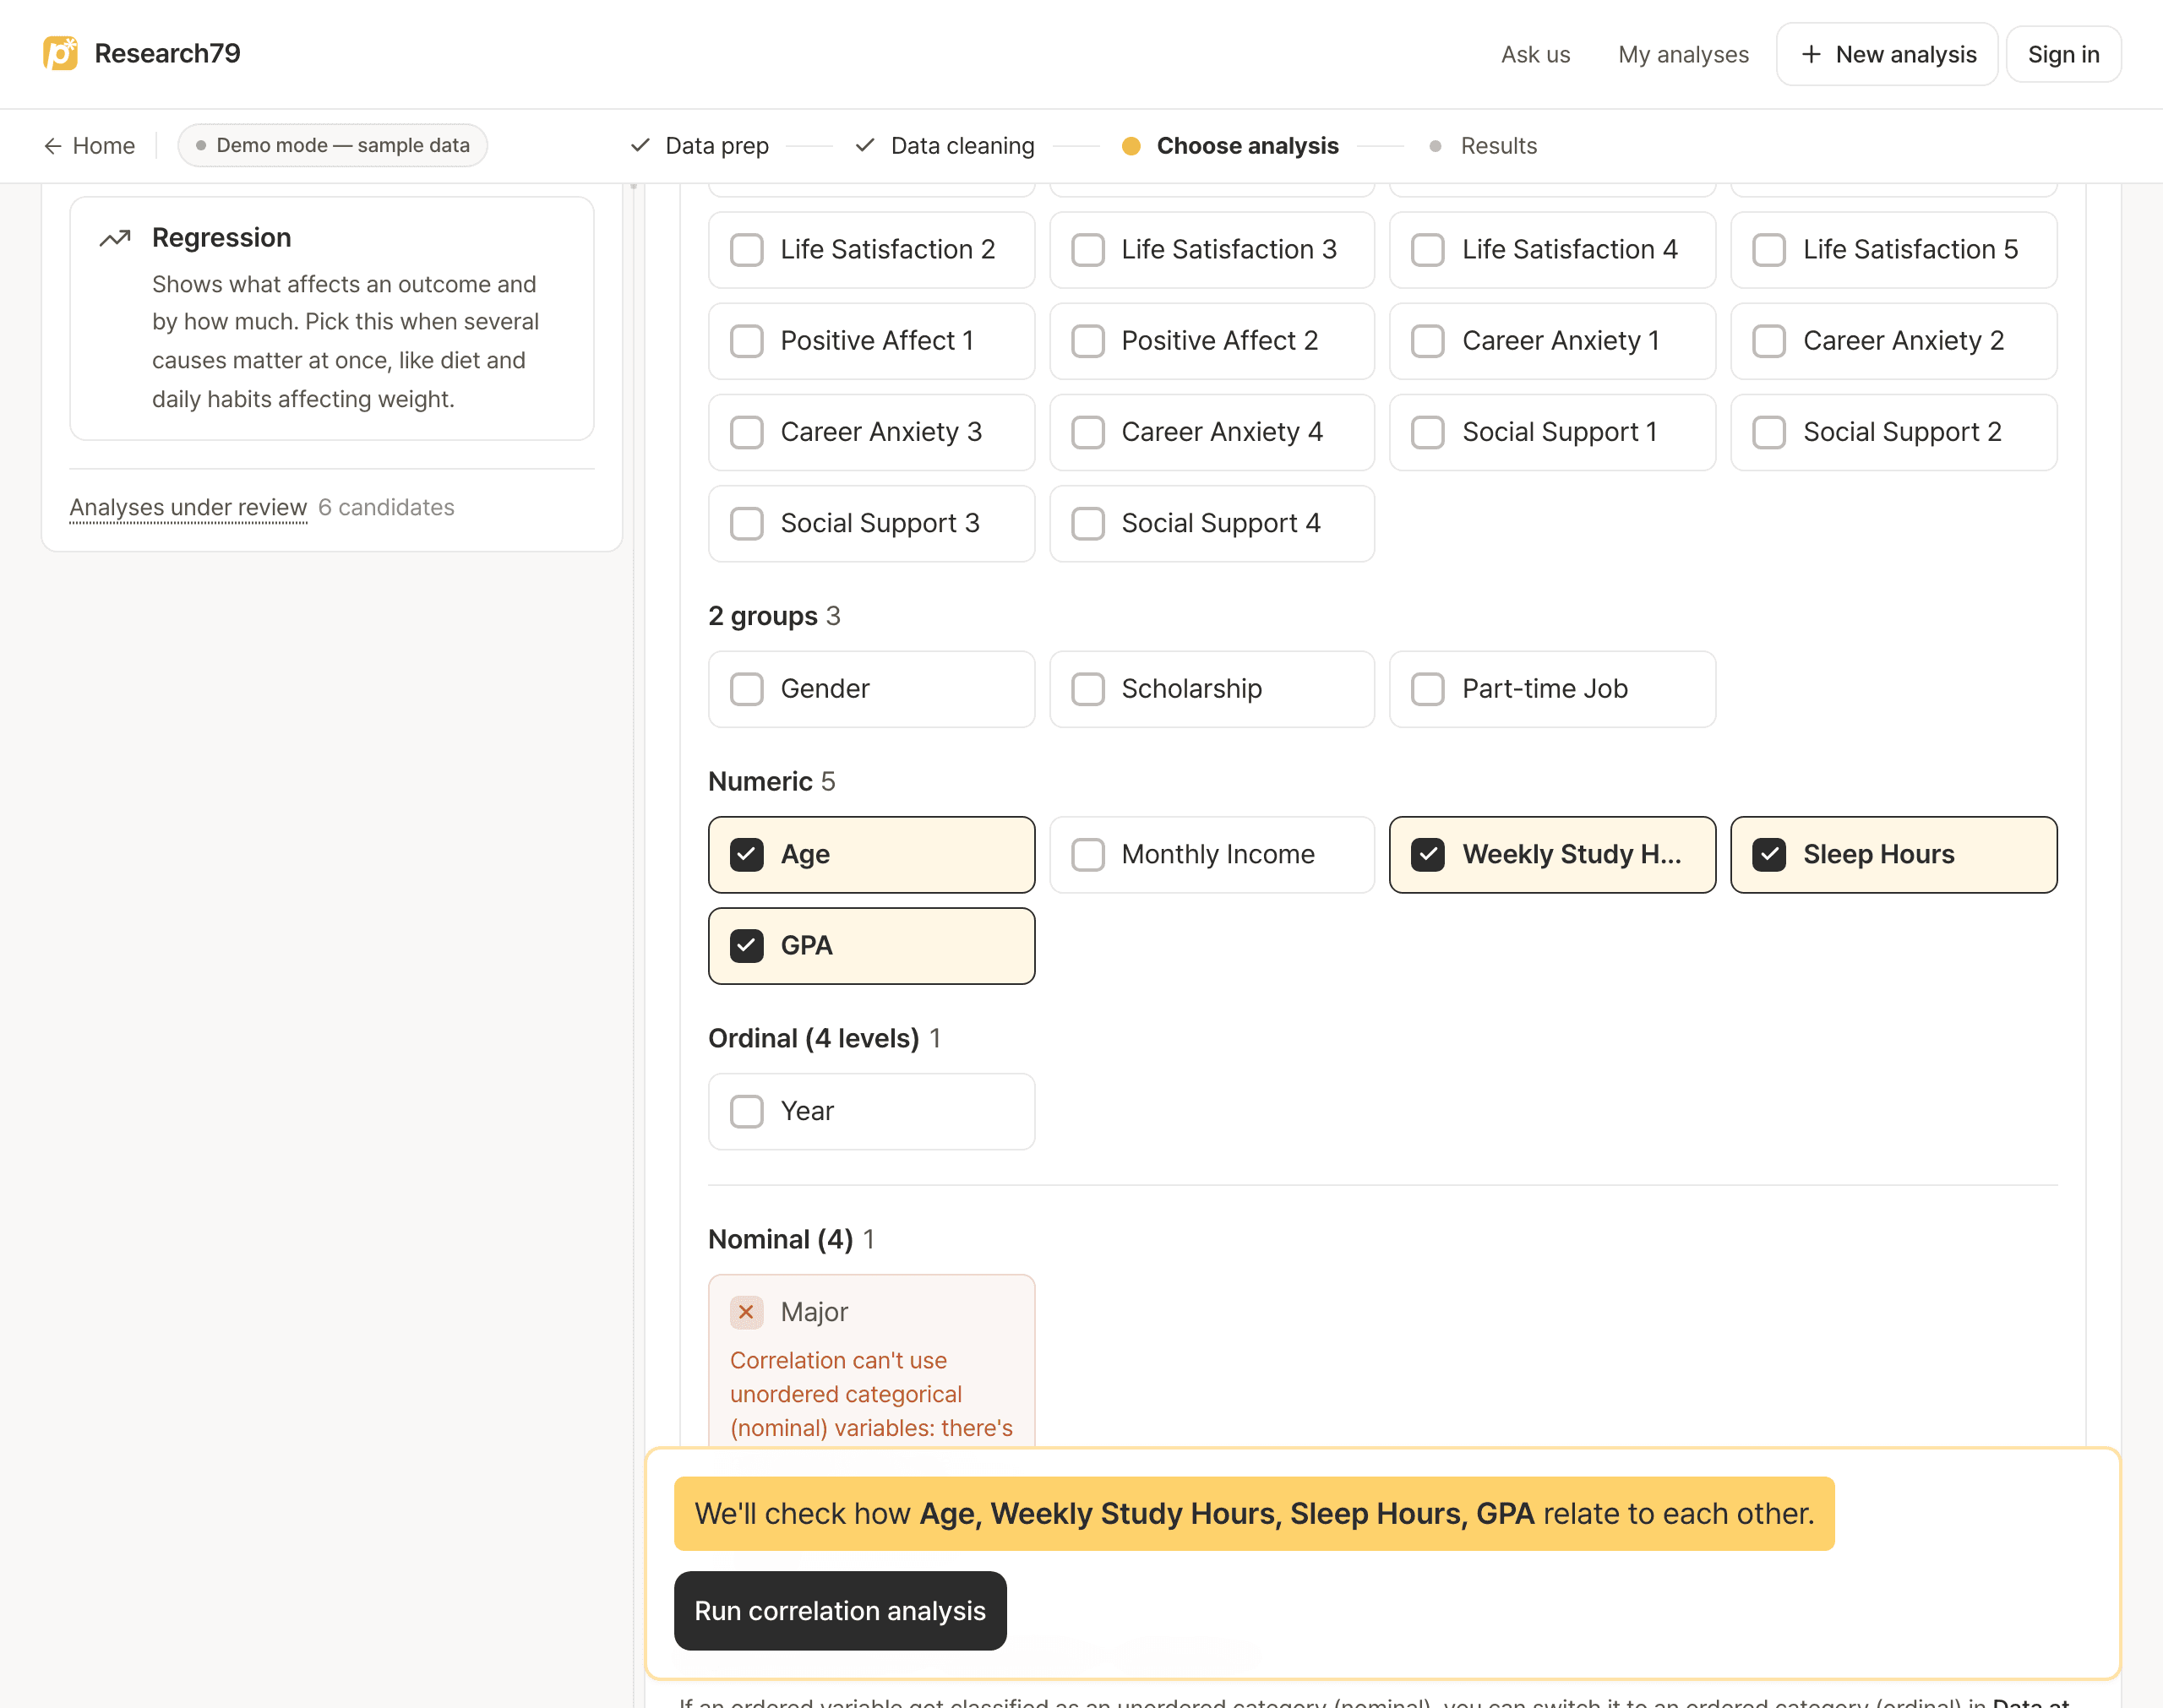
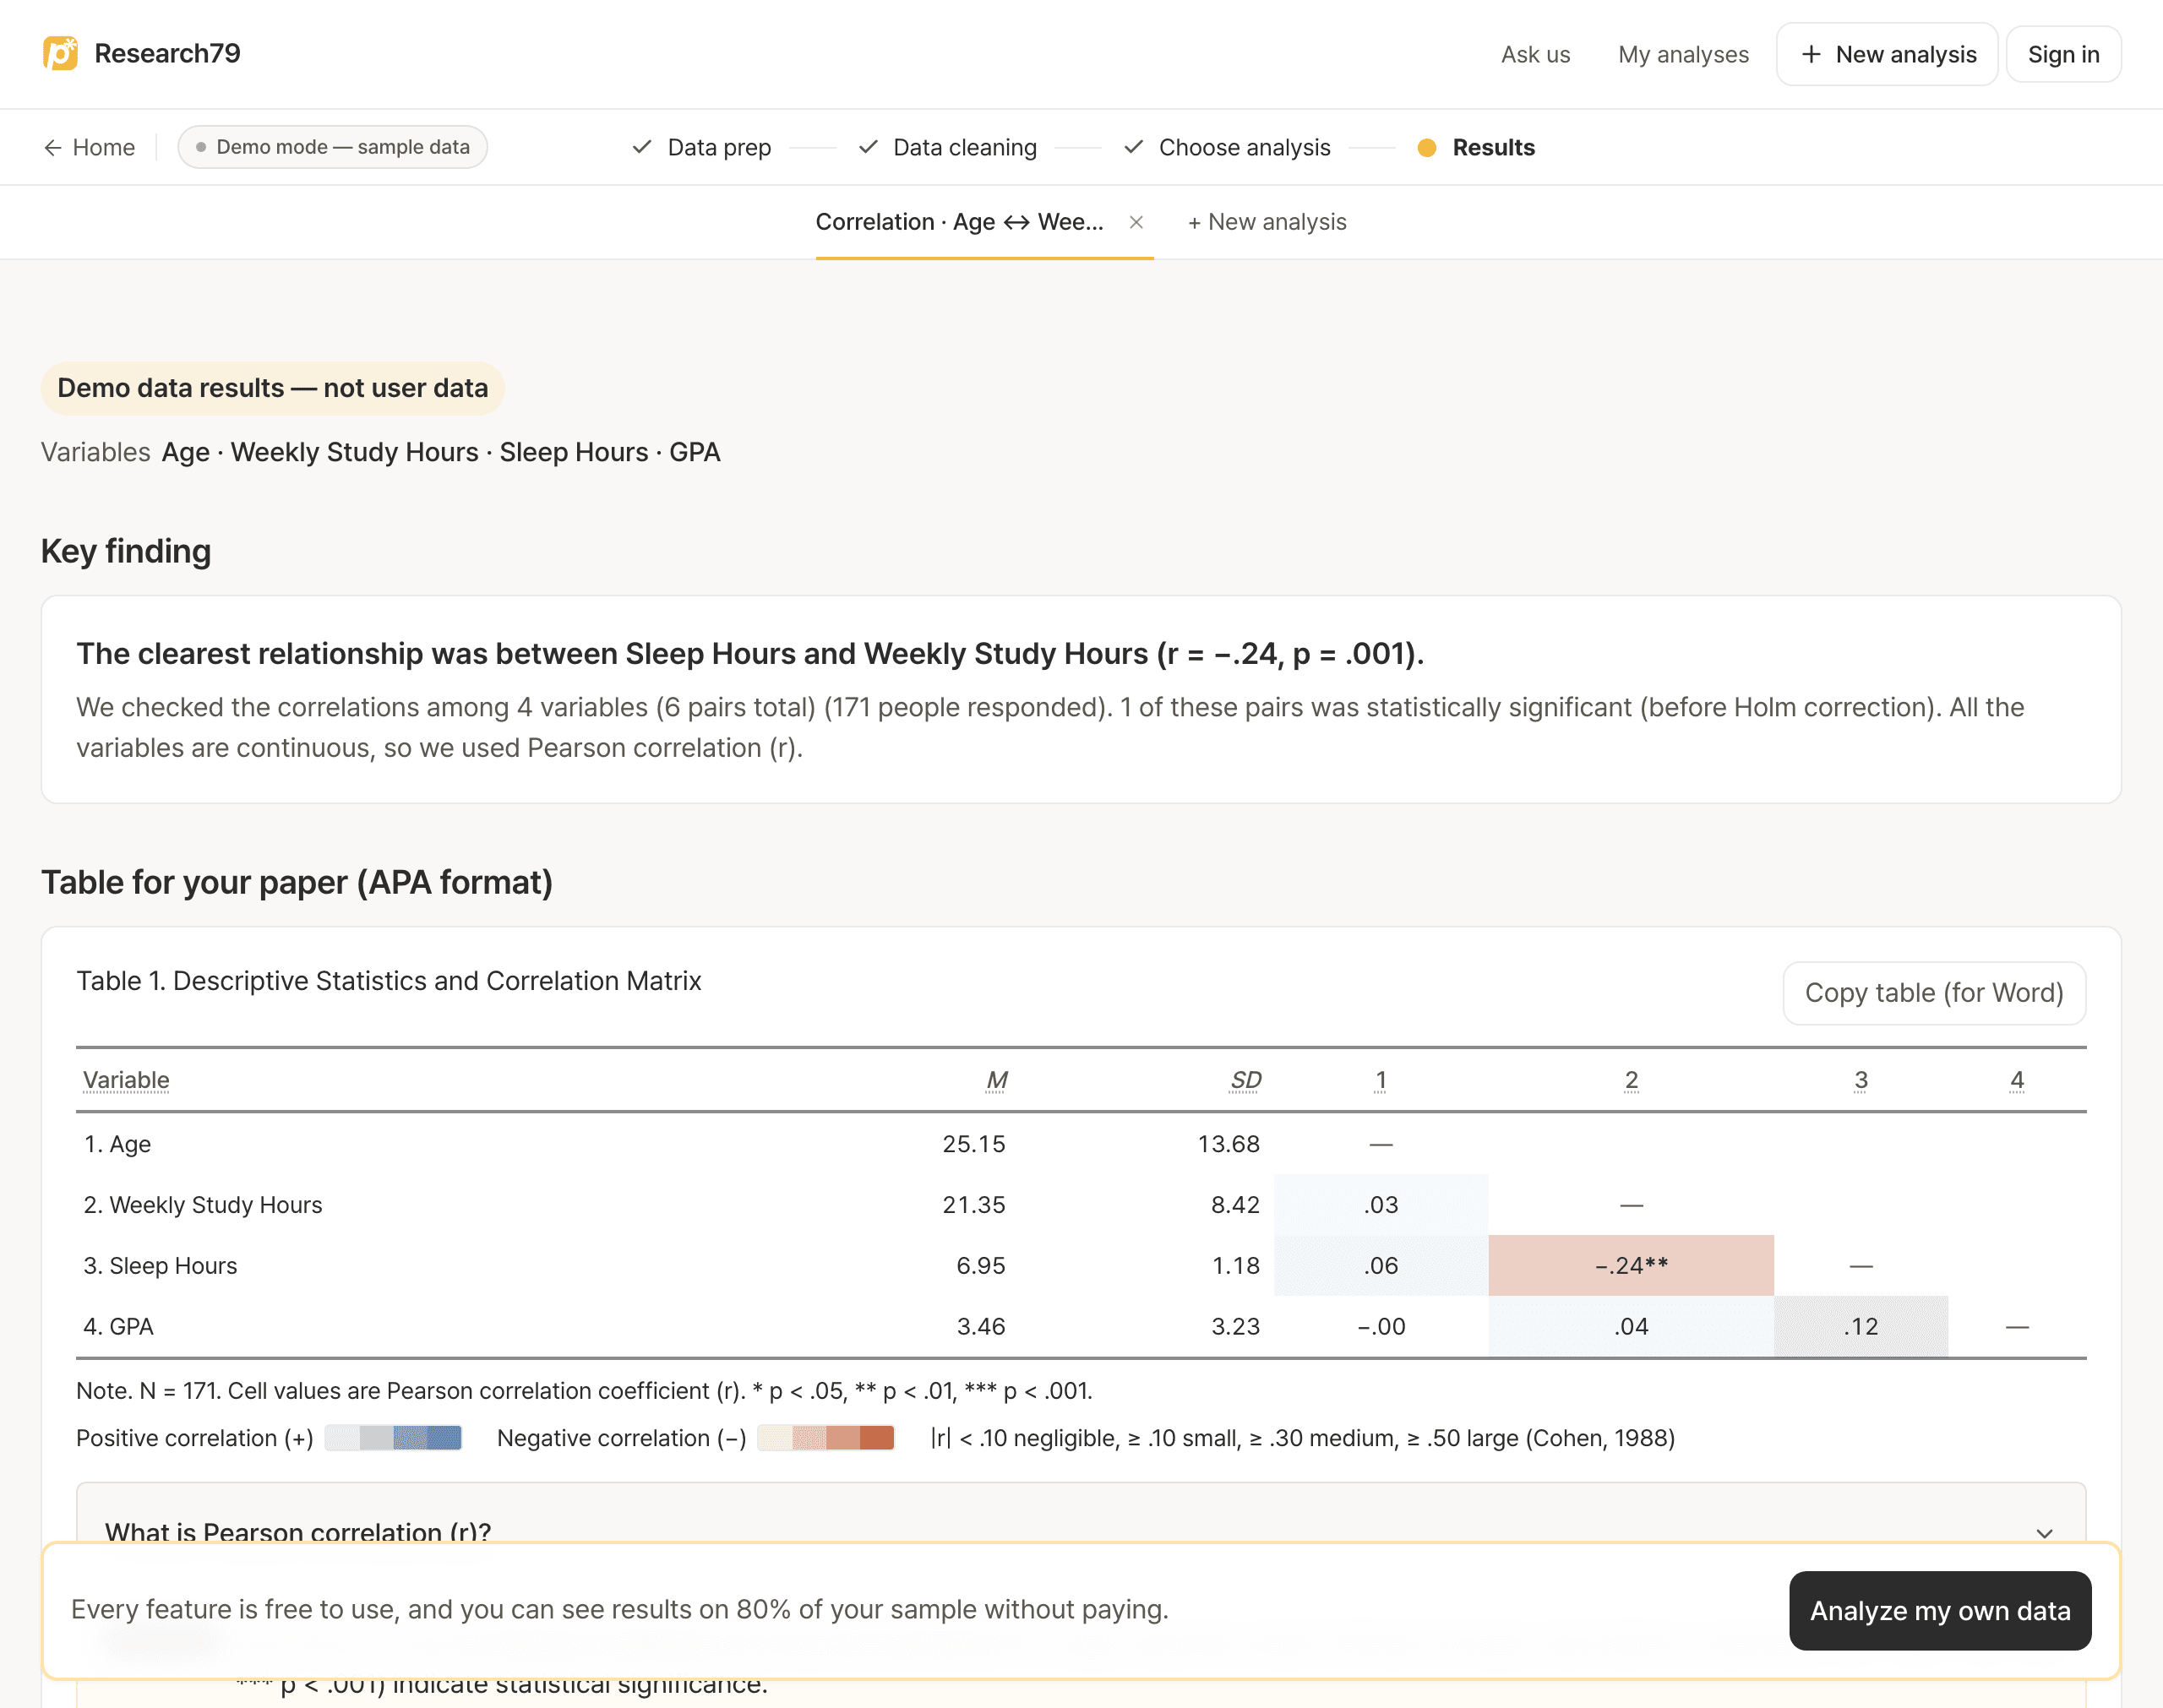
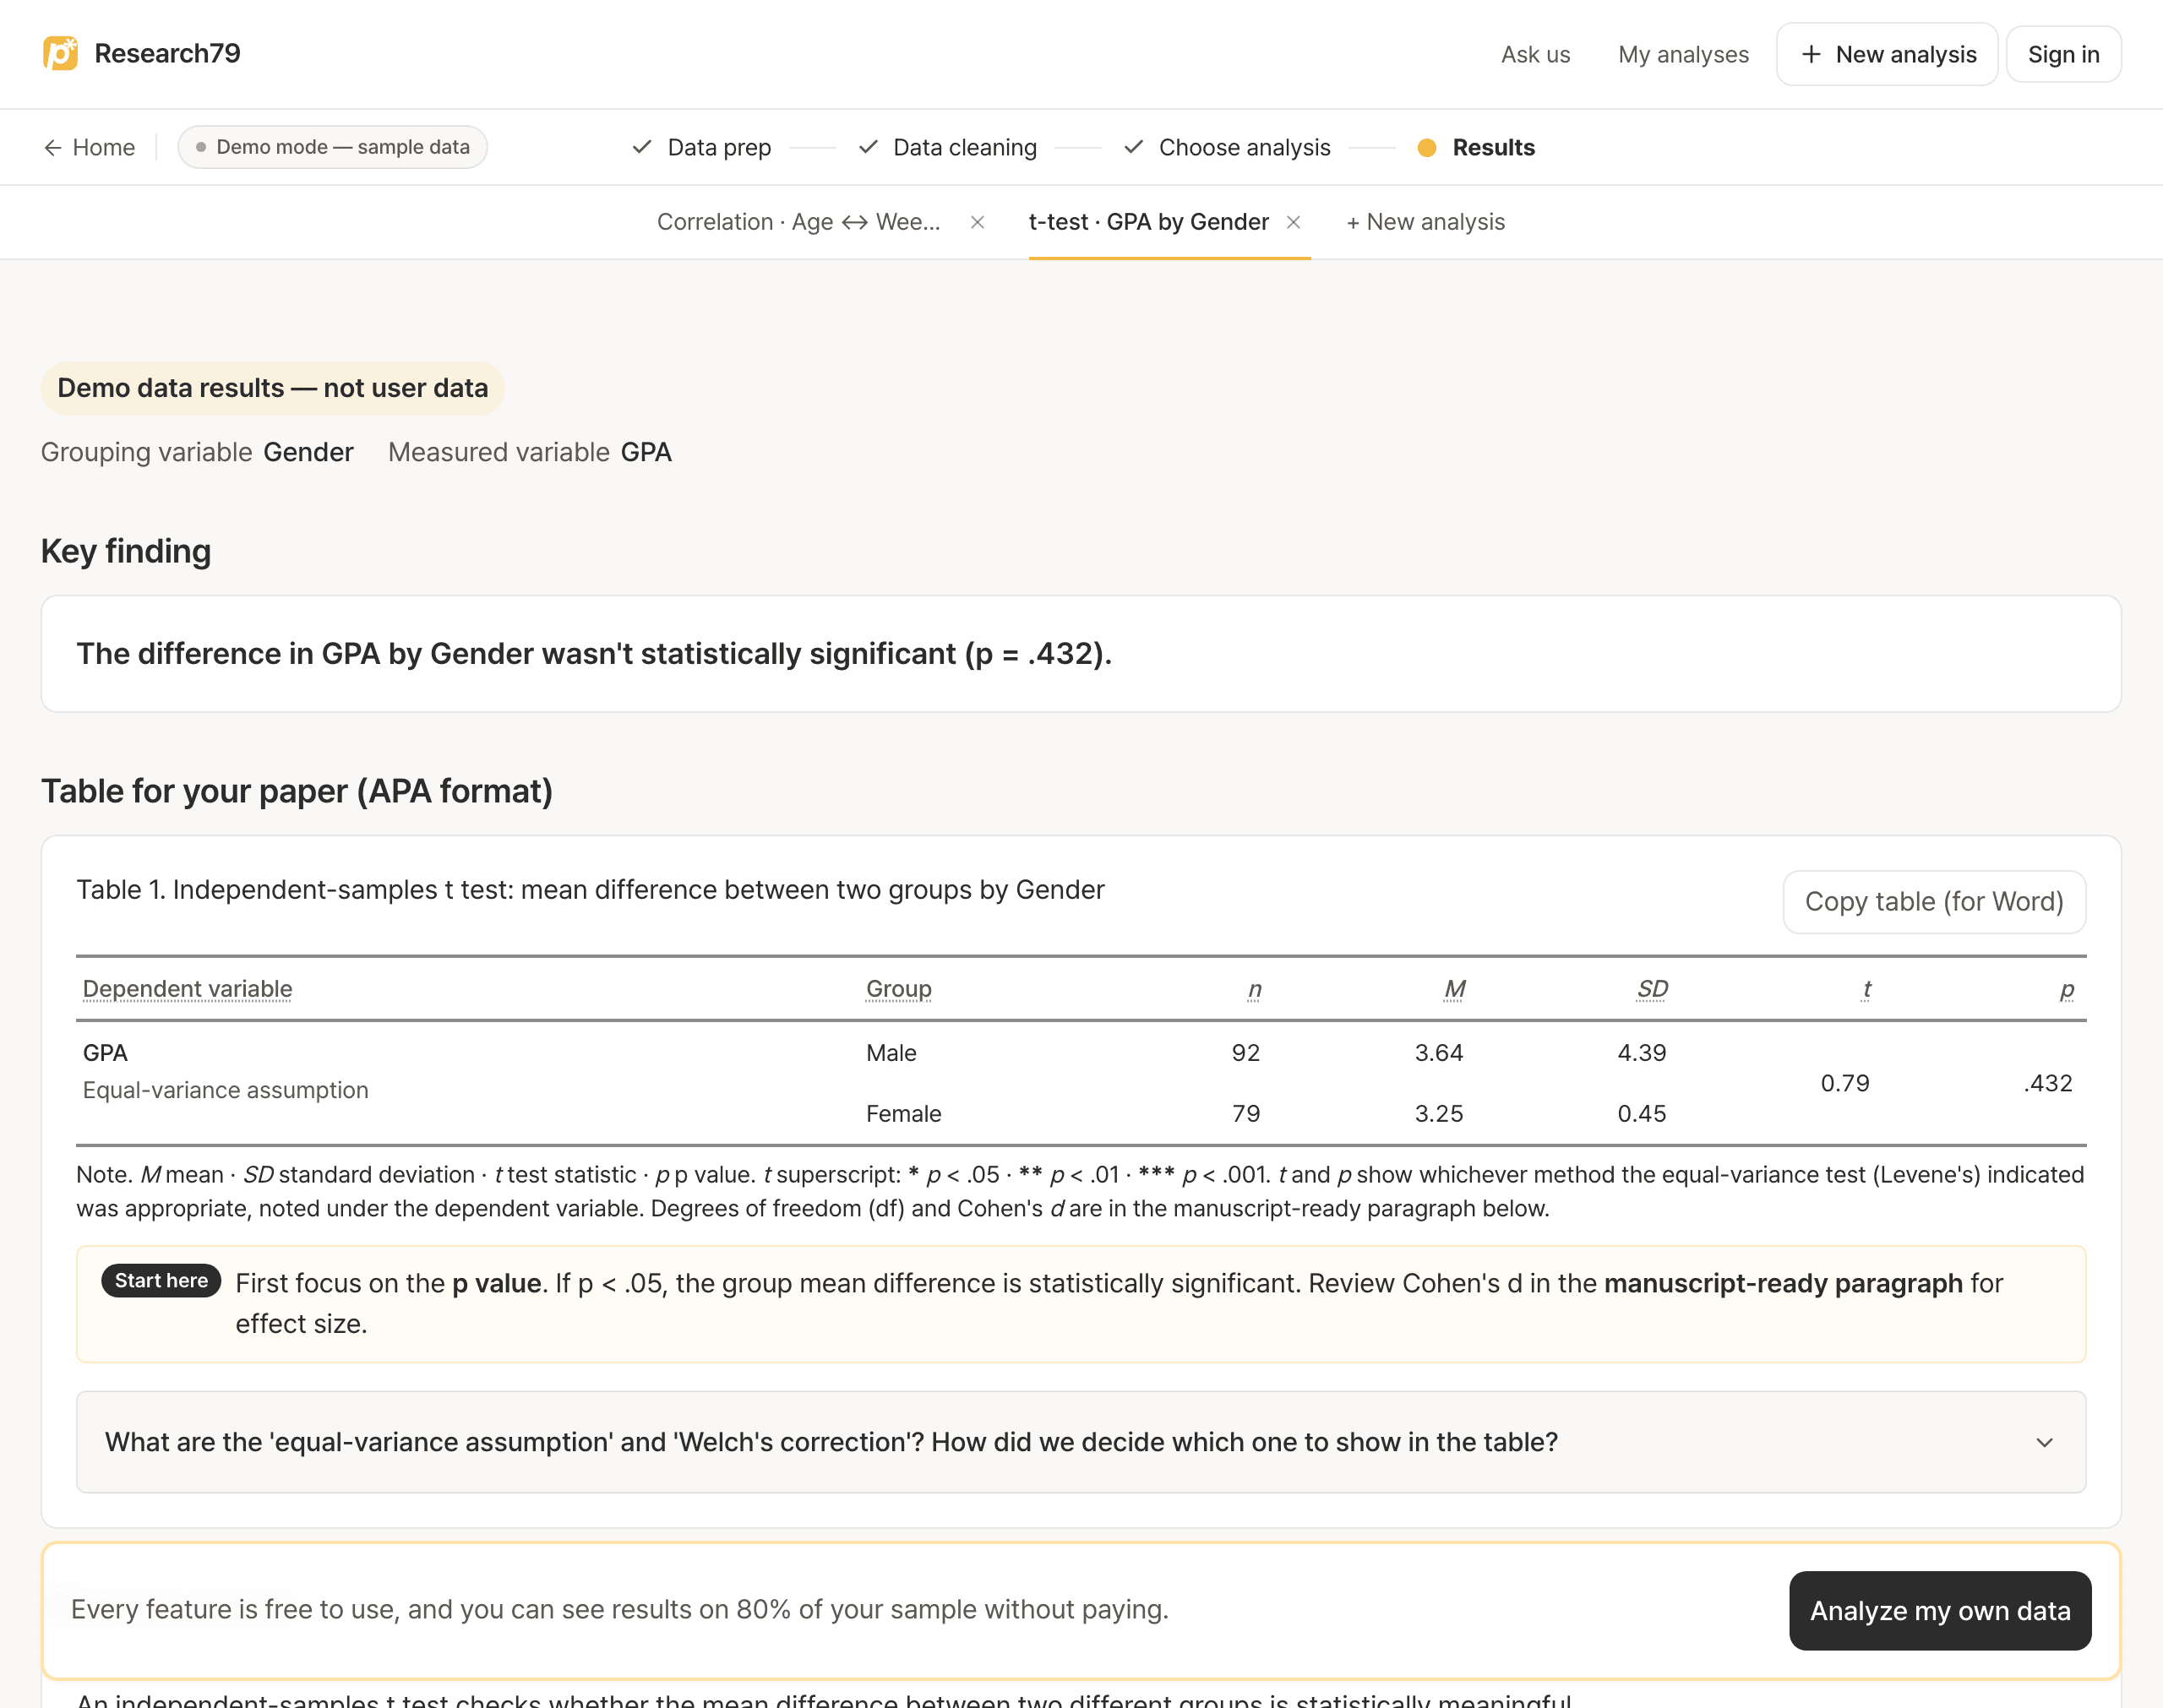
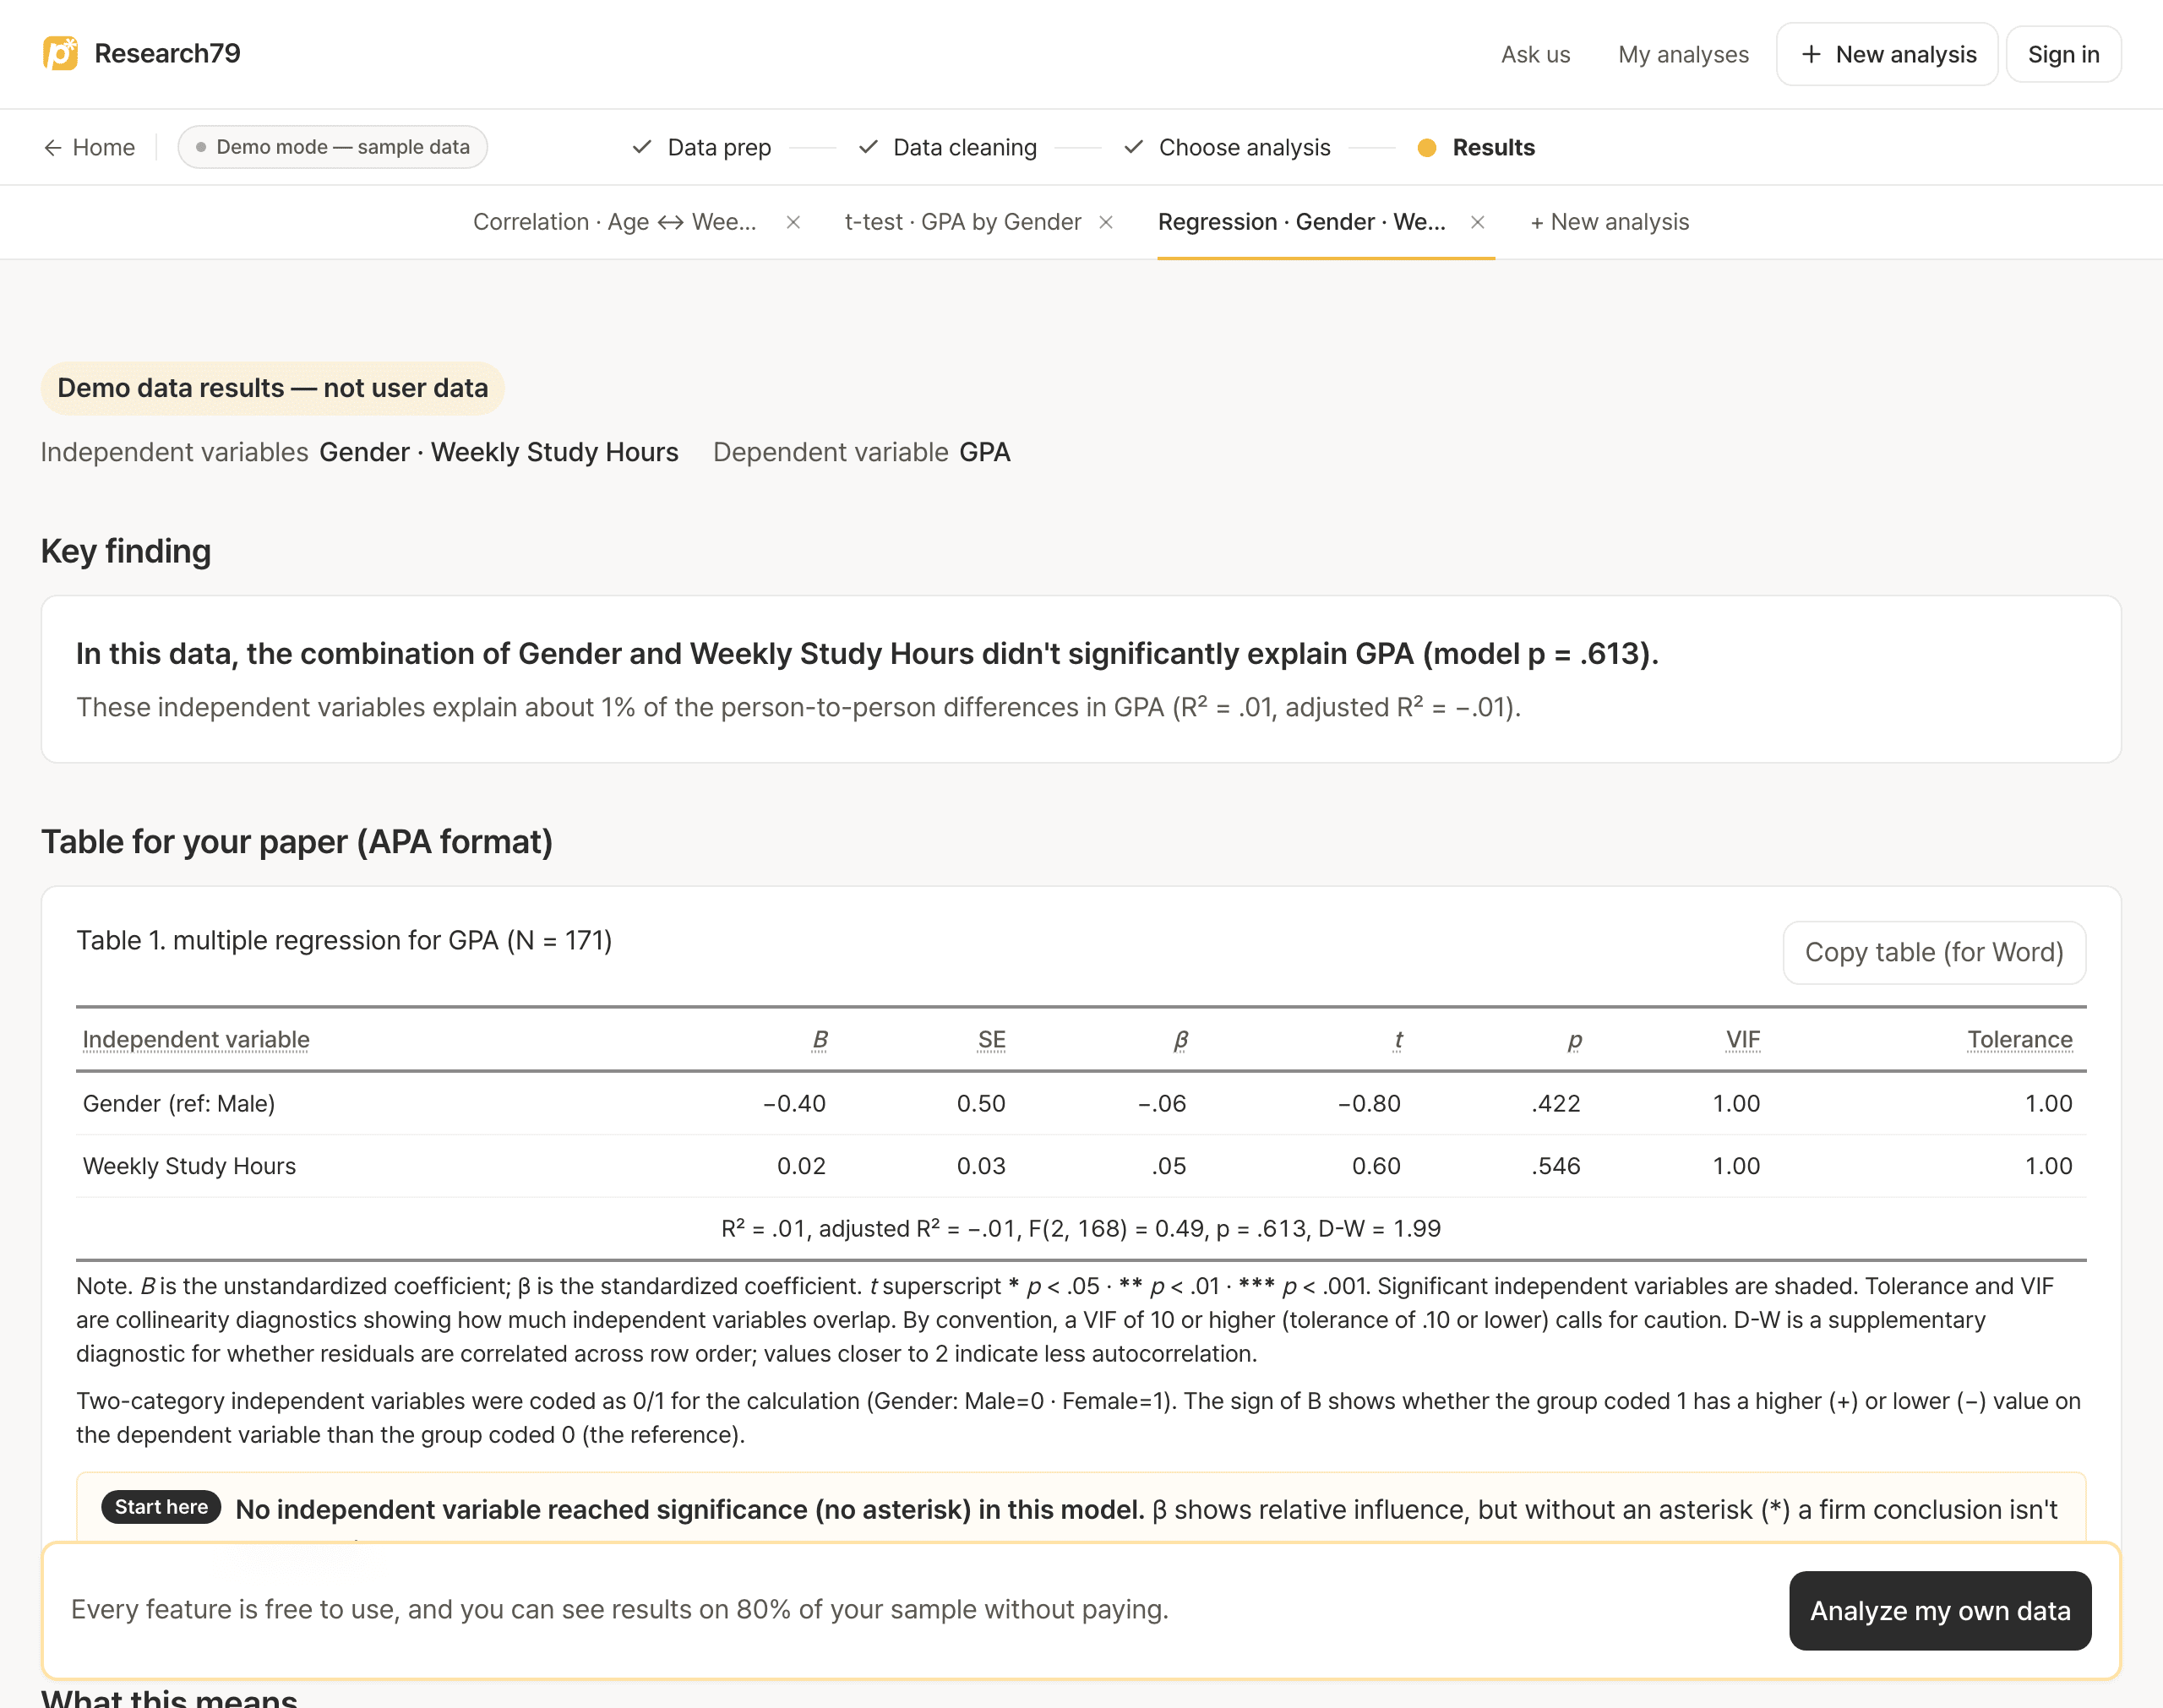
Read your results in plain language, with APA tables and sentences for your paper
Copy the tables and sentences straight into Word or your document editor.
Swipe sideways to inspect the screen at full size.
Tedious data cleaning, done with a few clicks
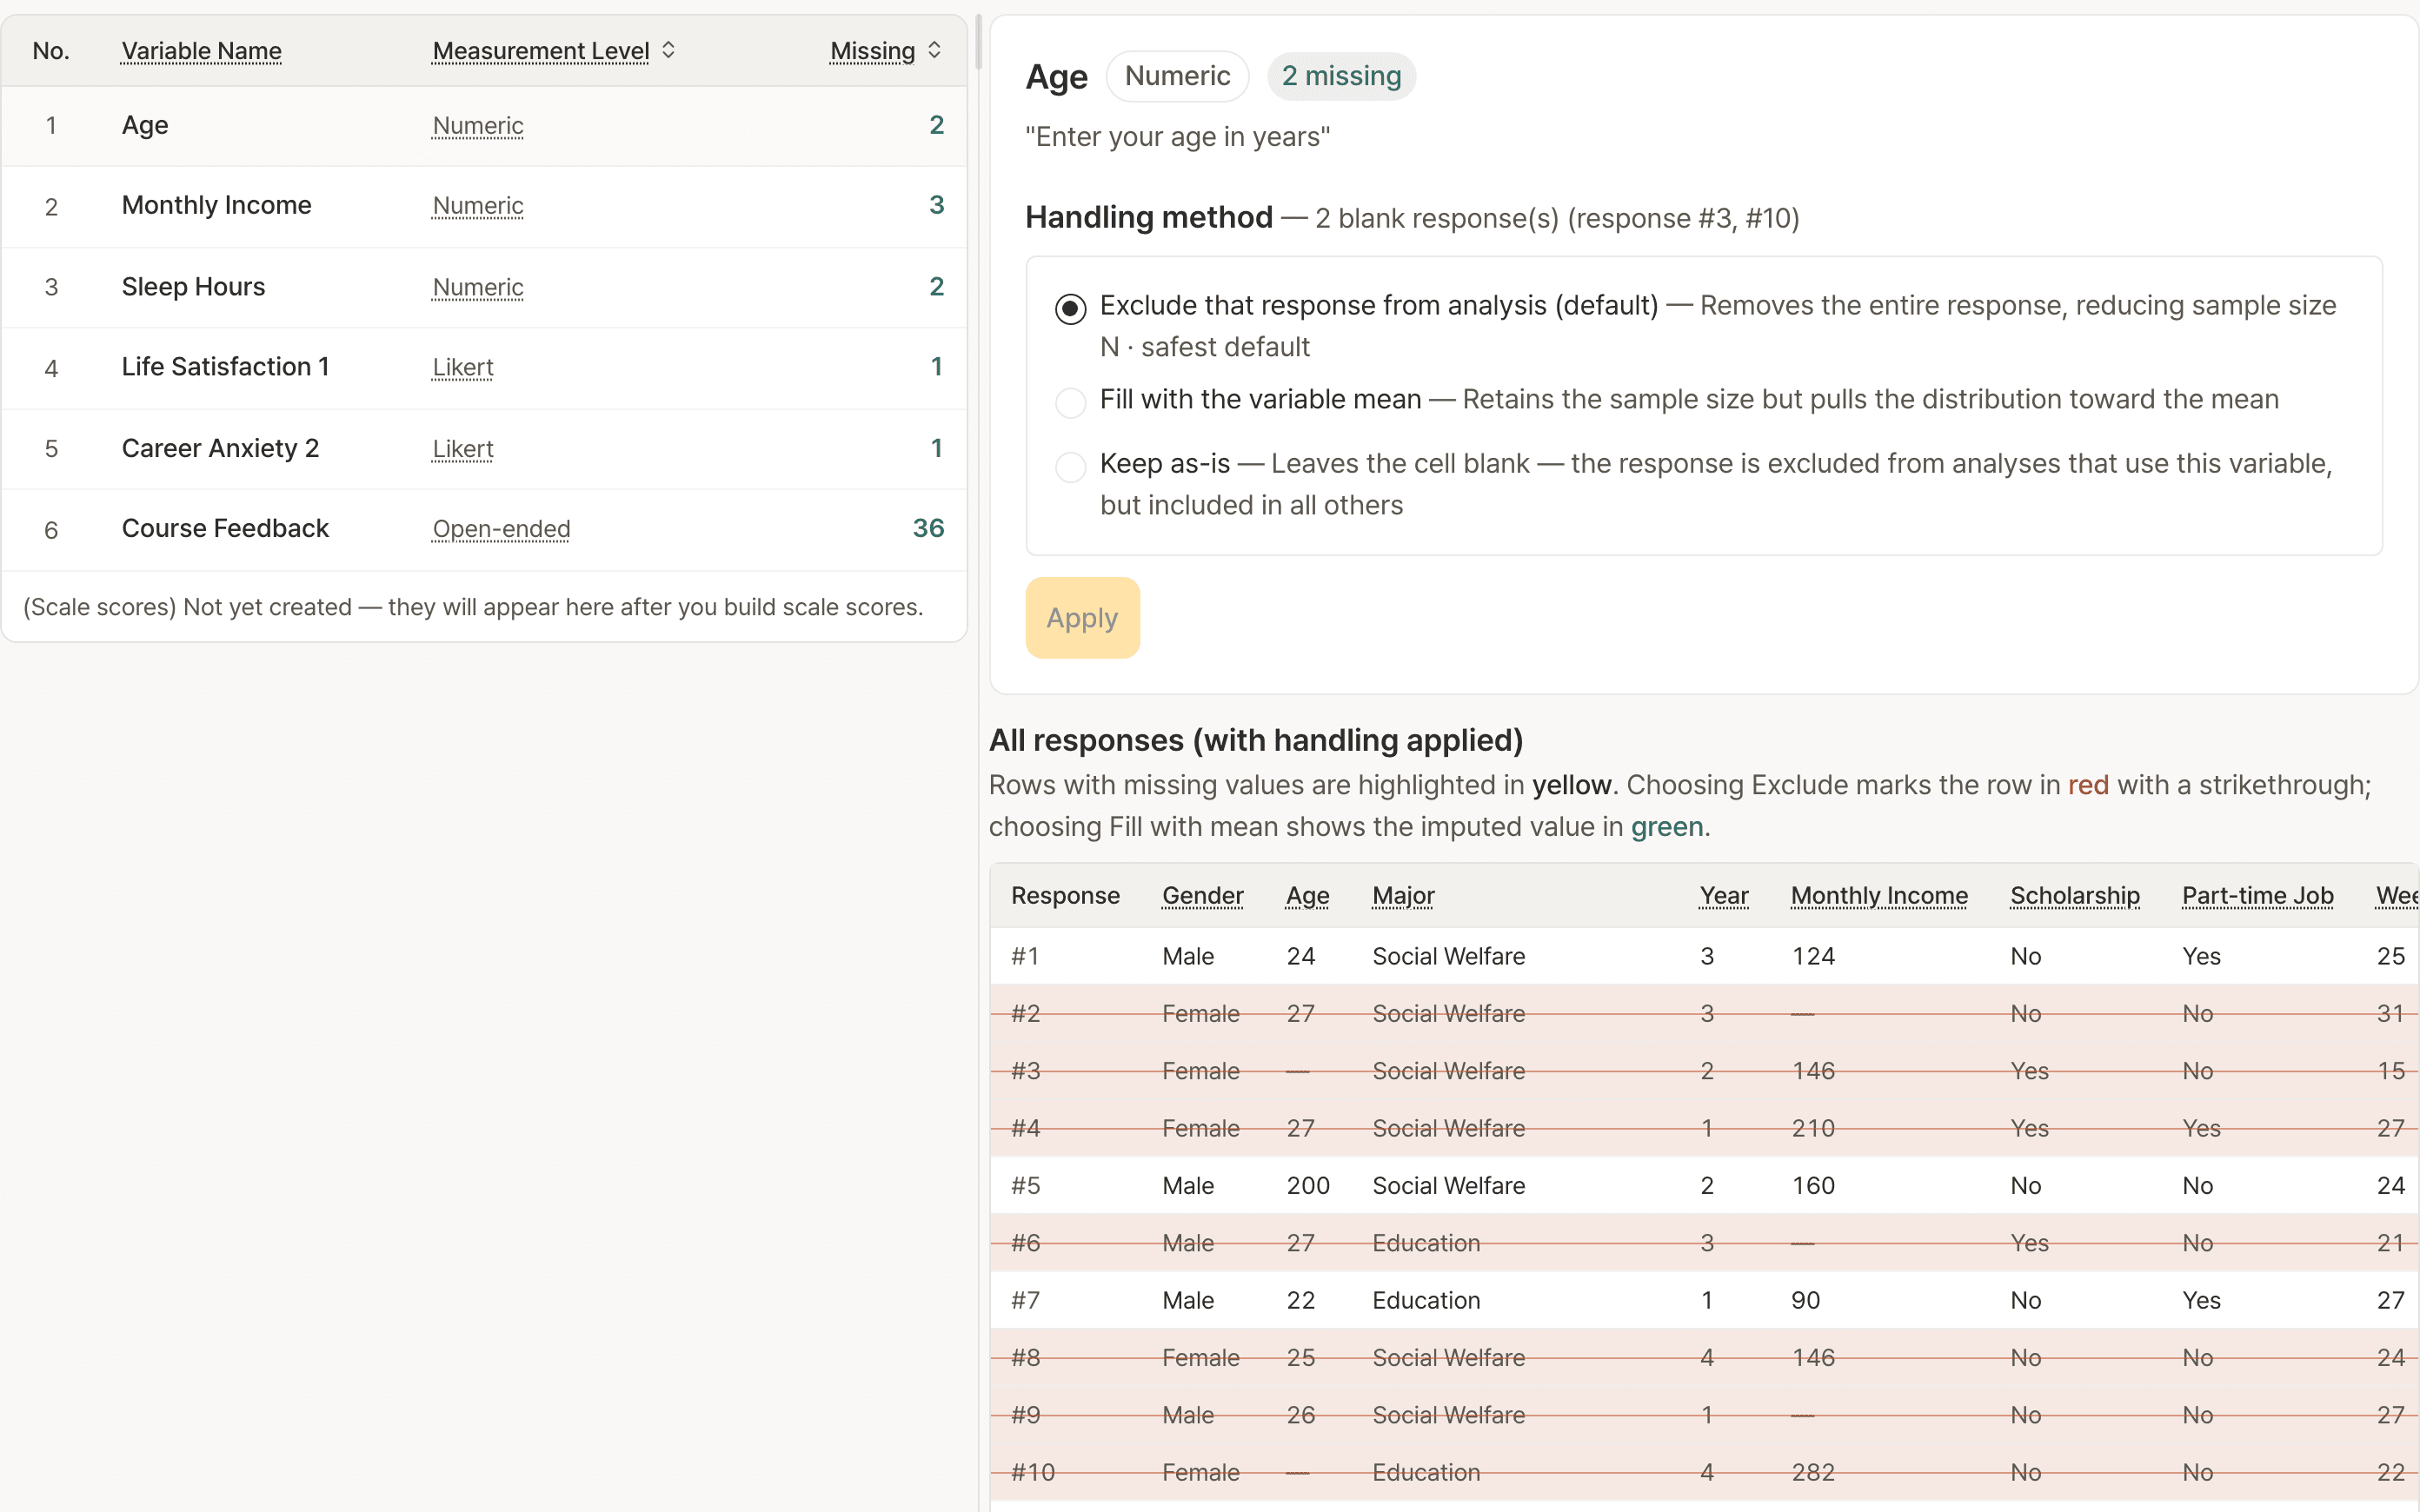
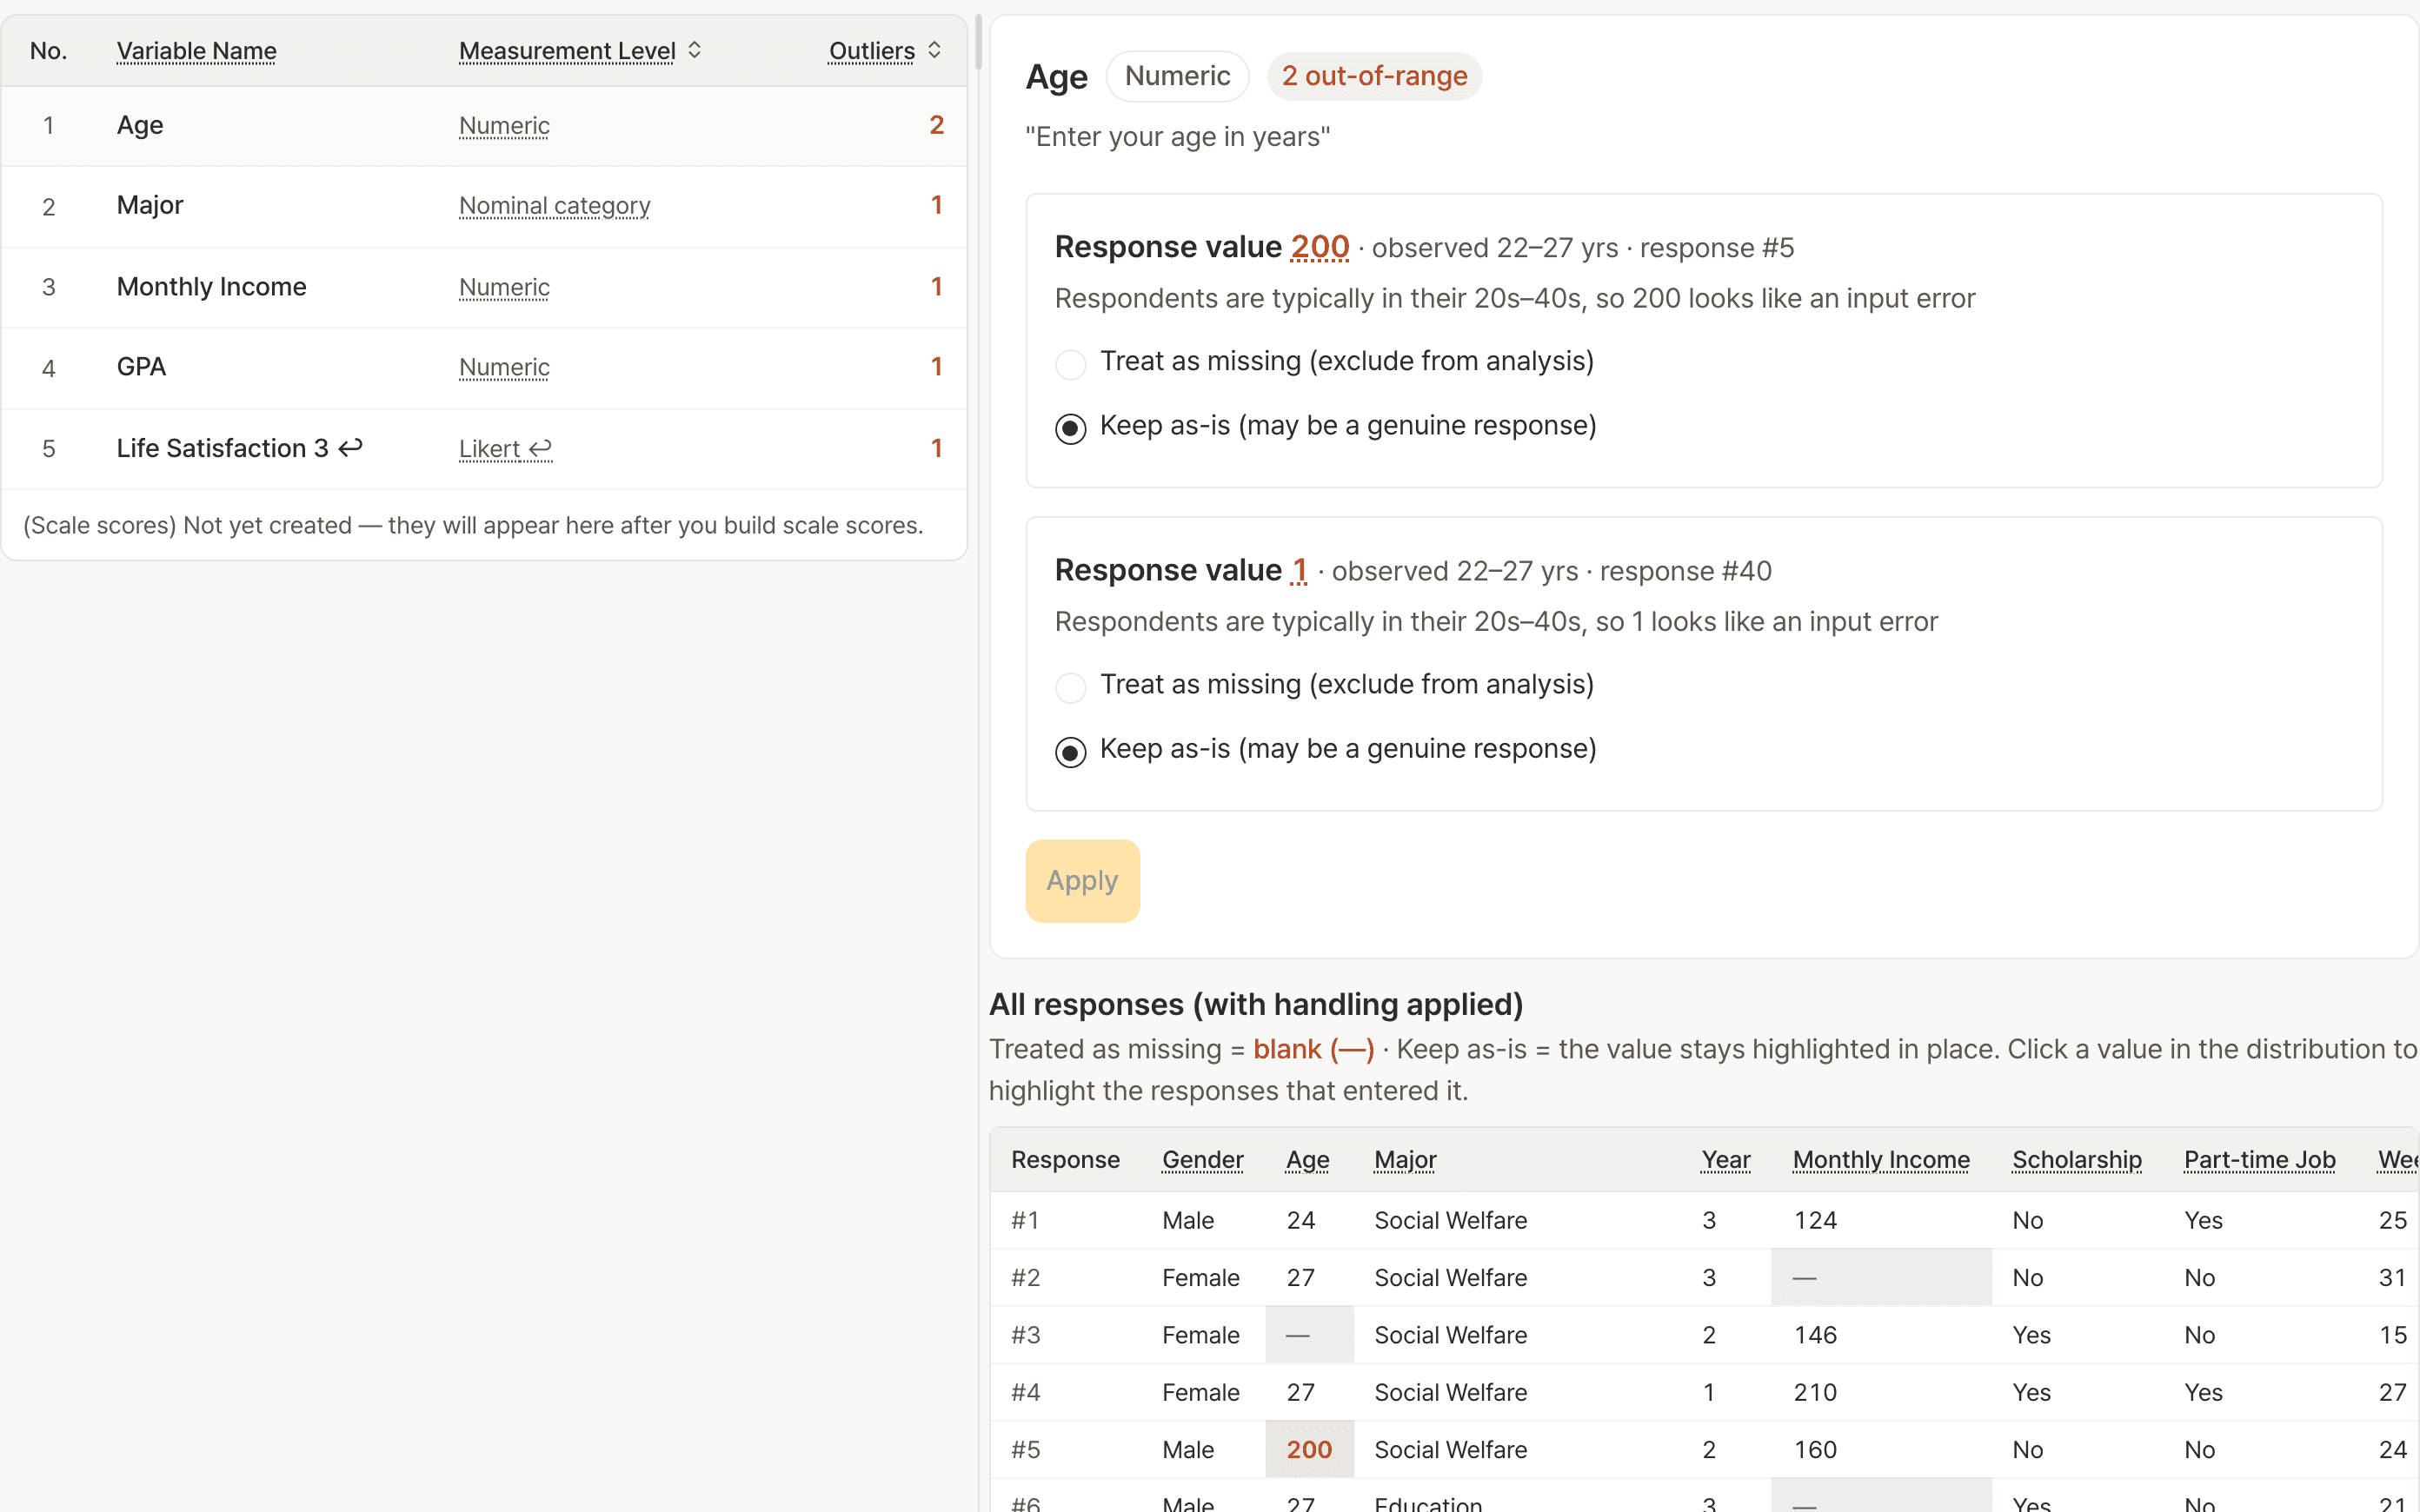
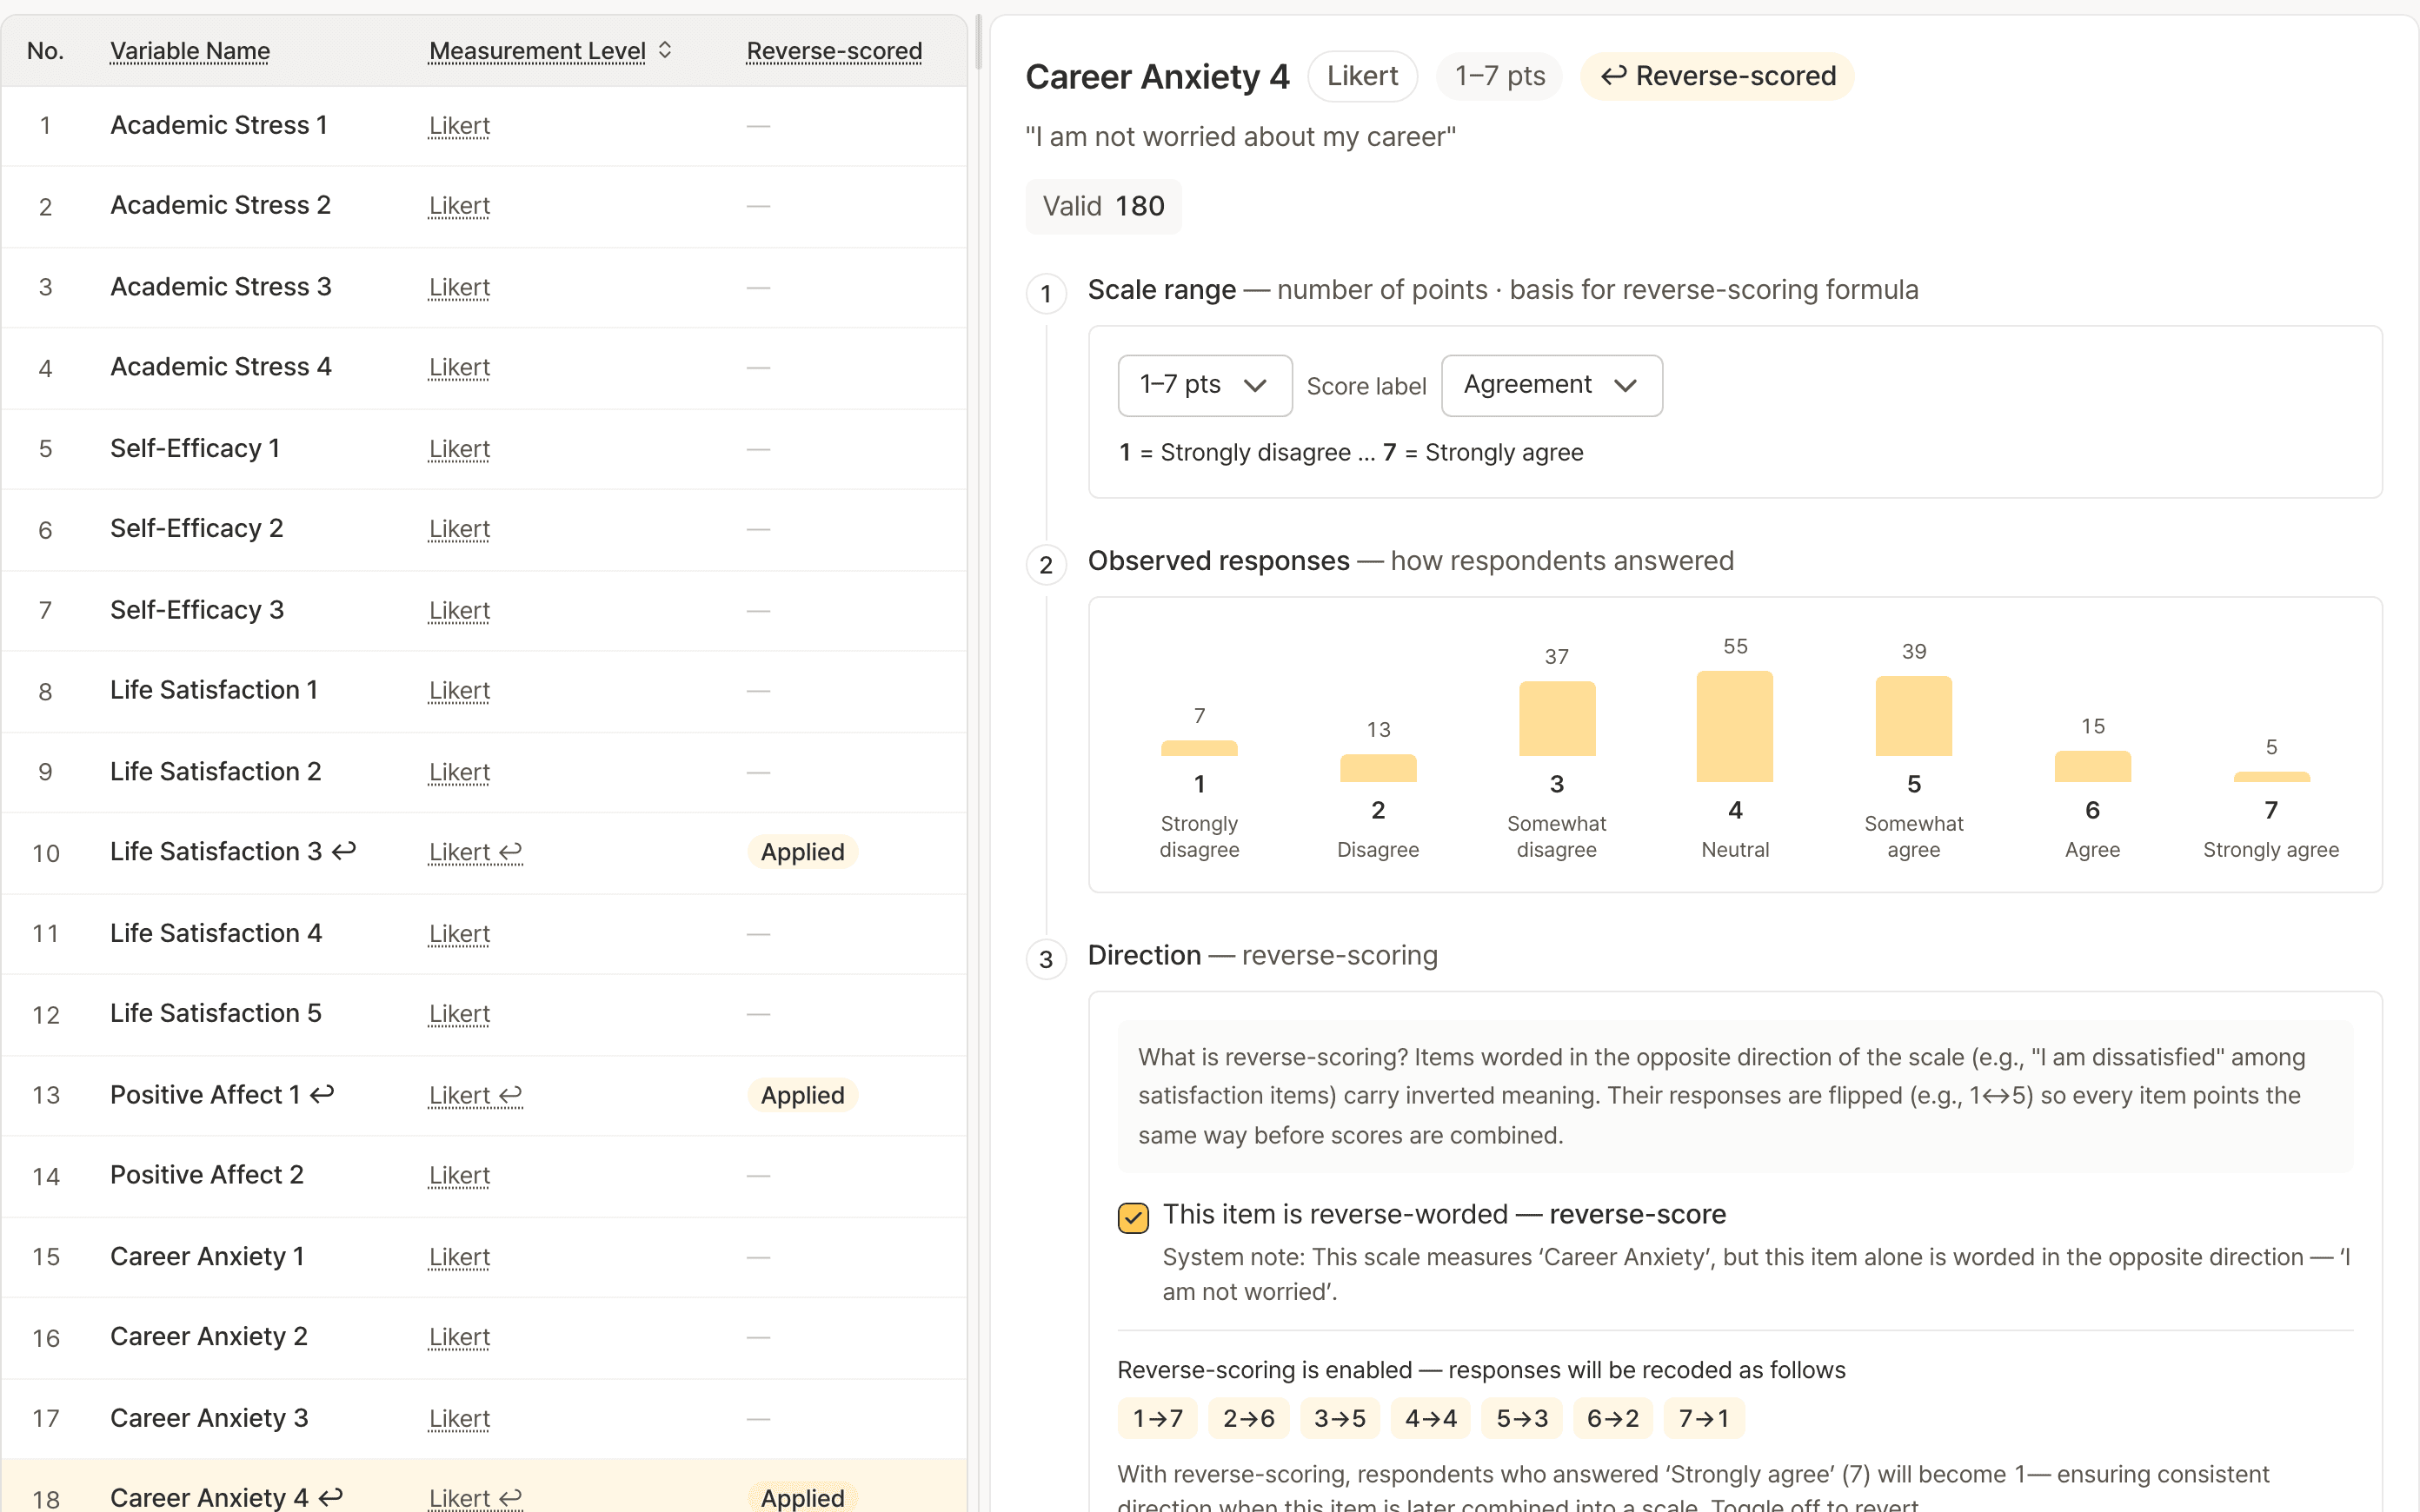
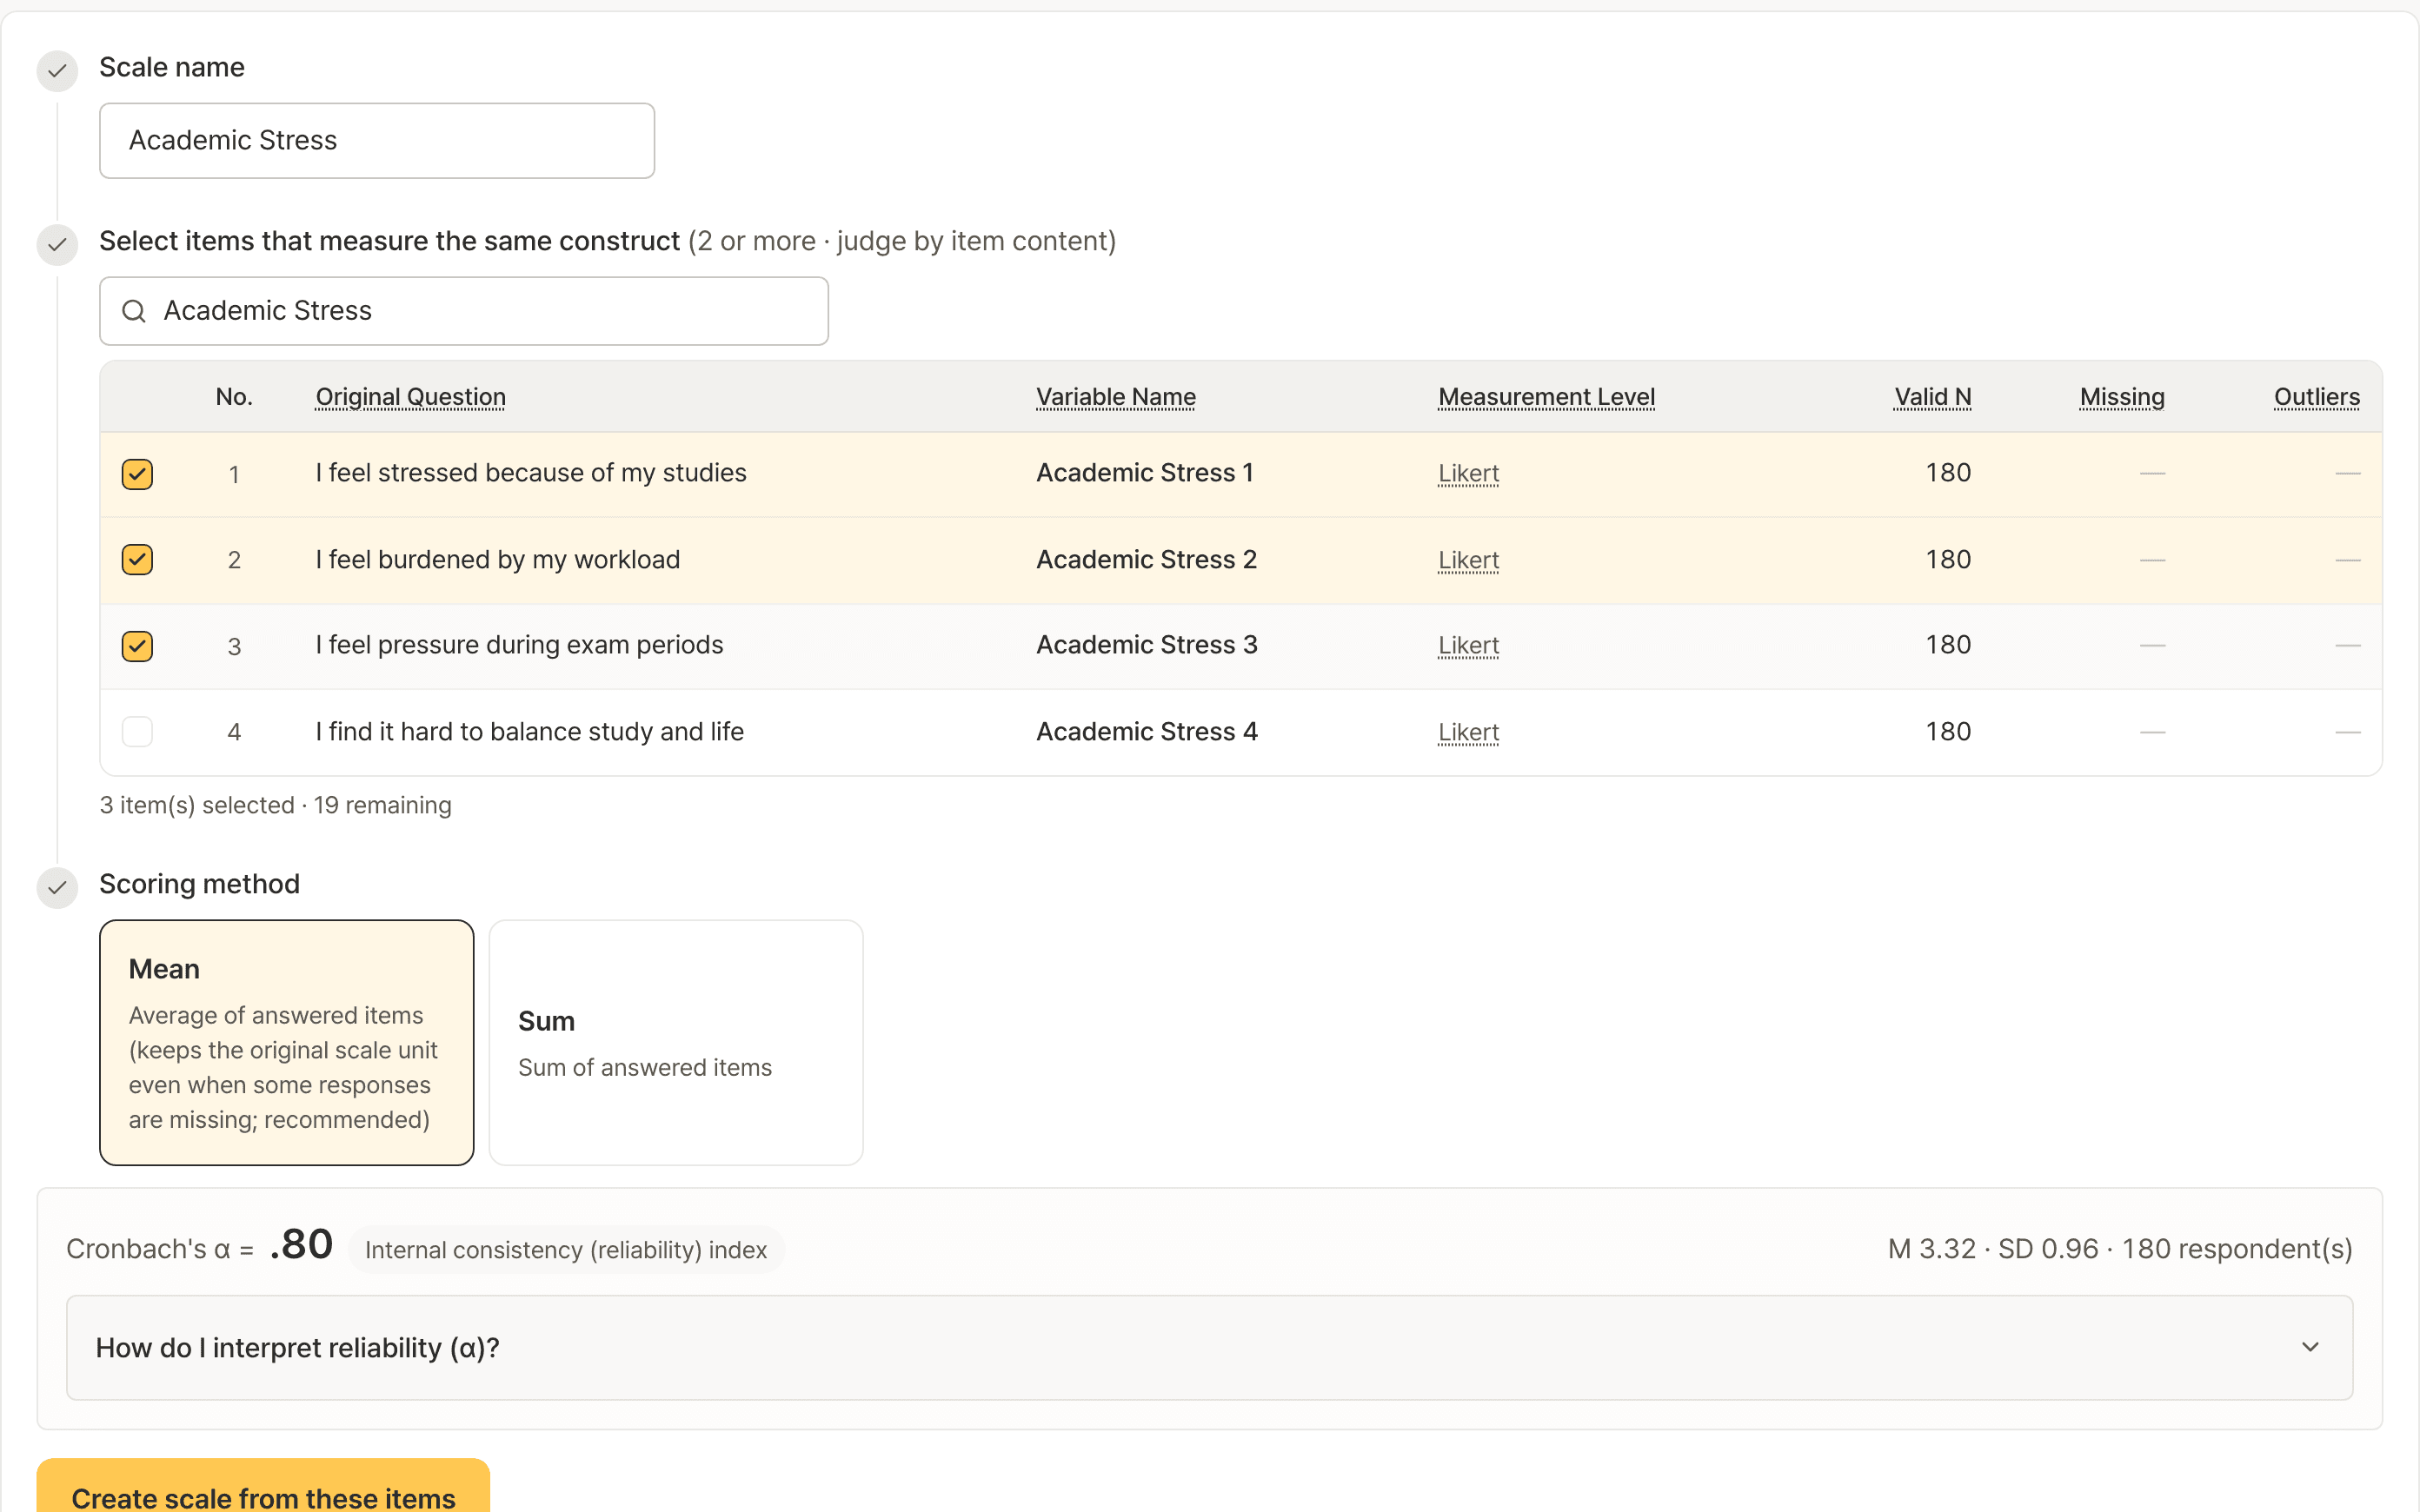
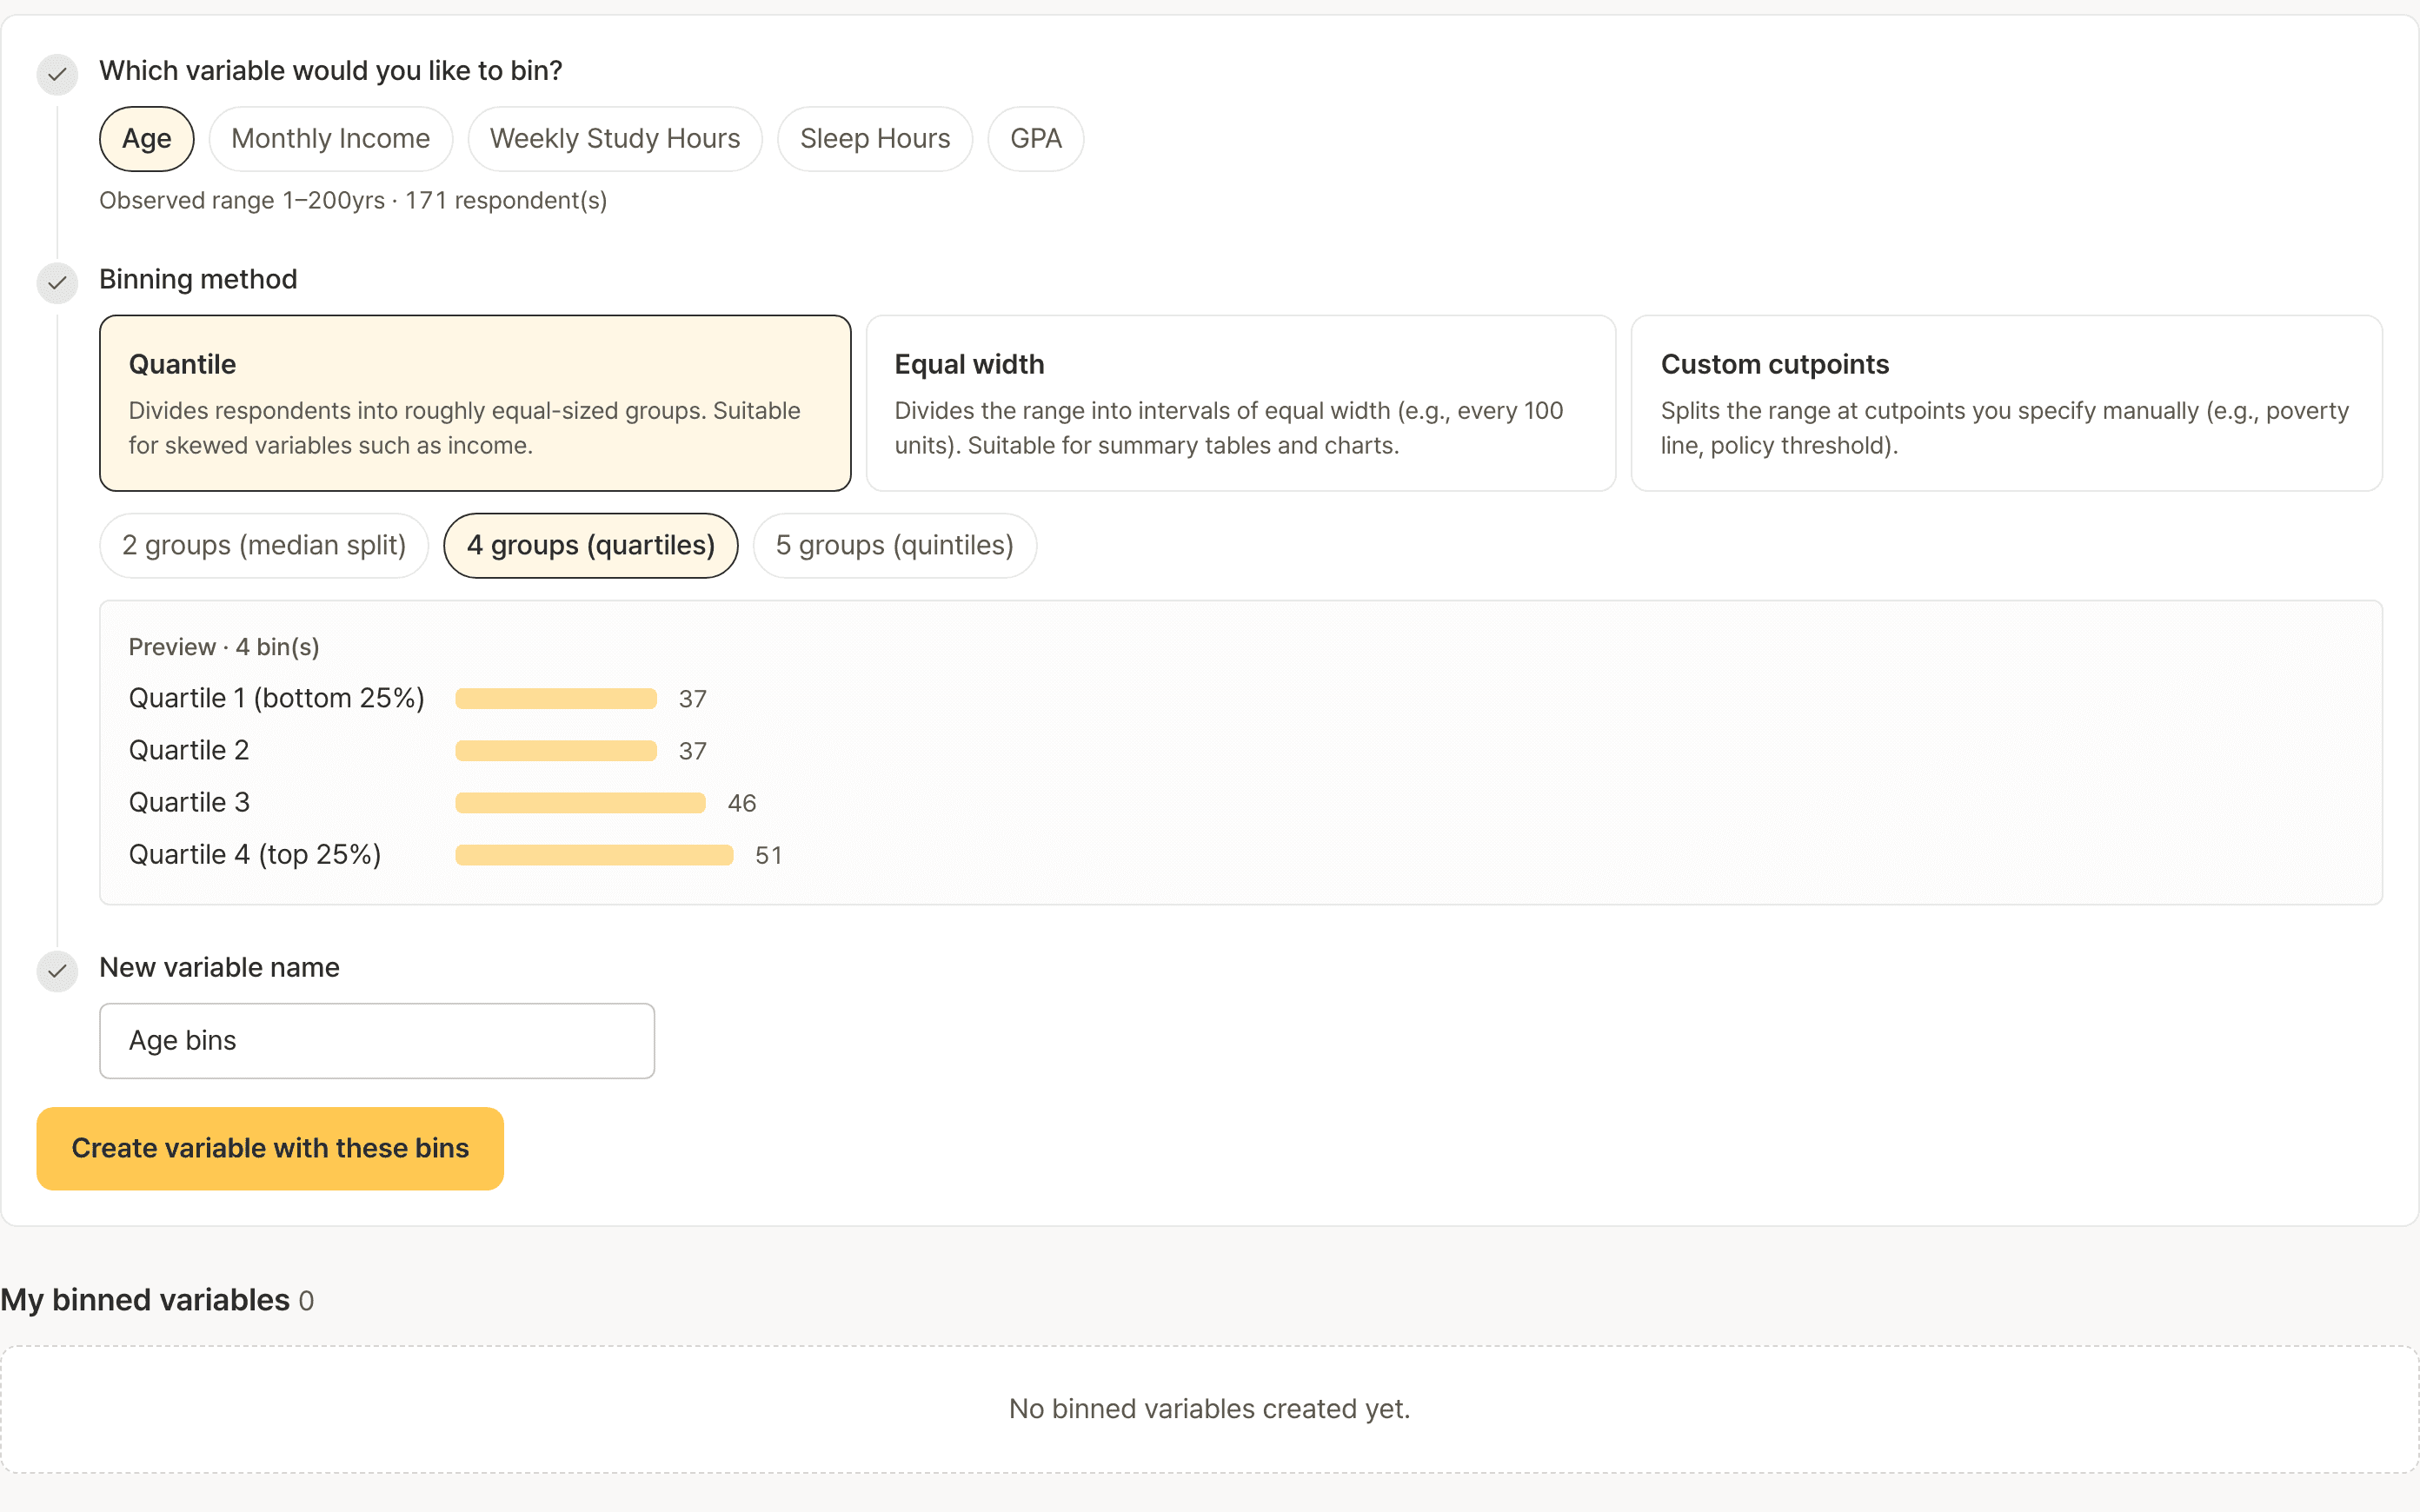
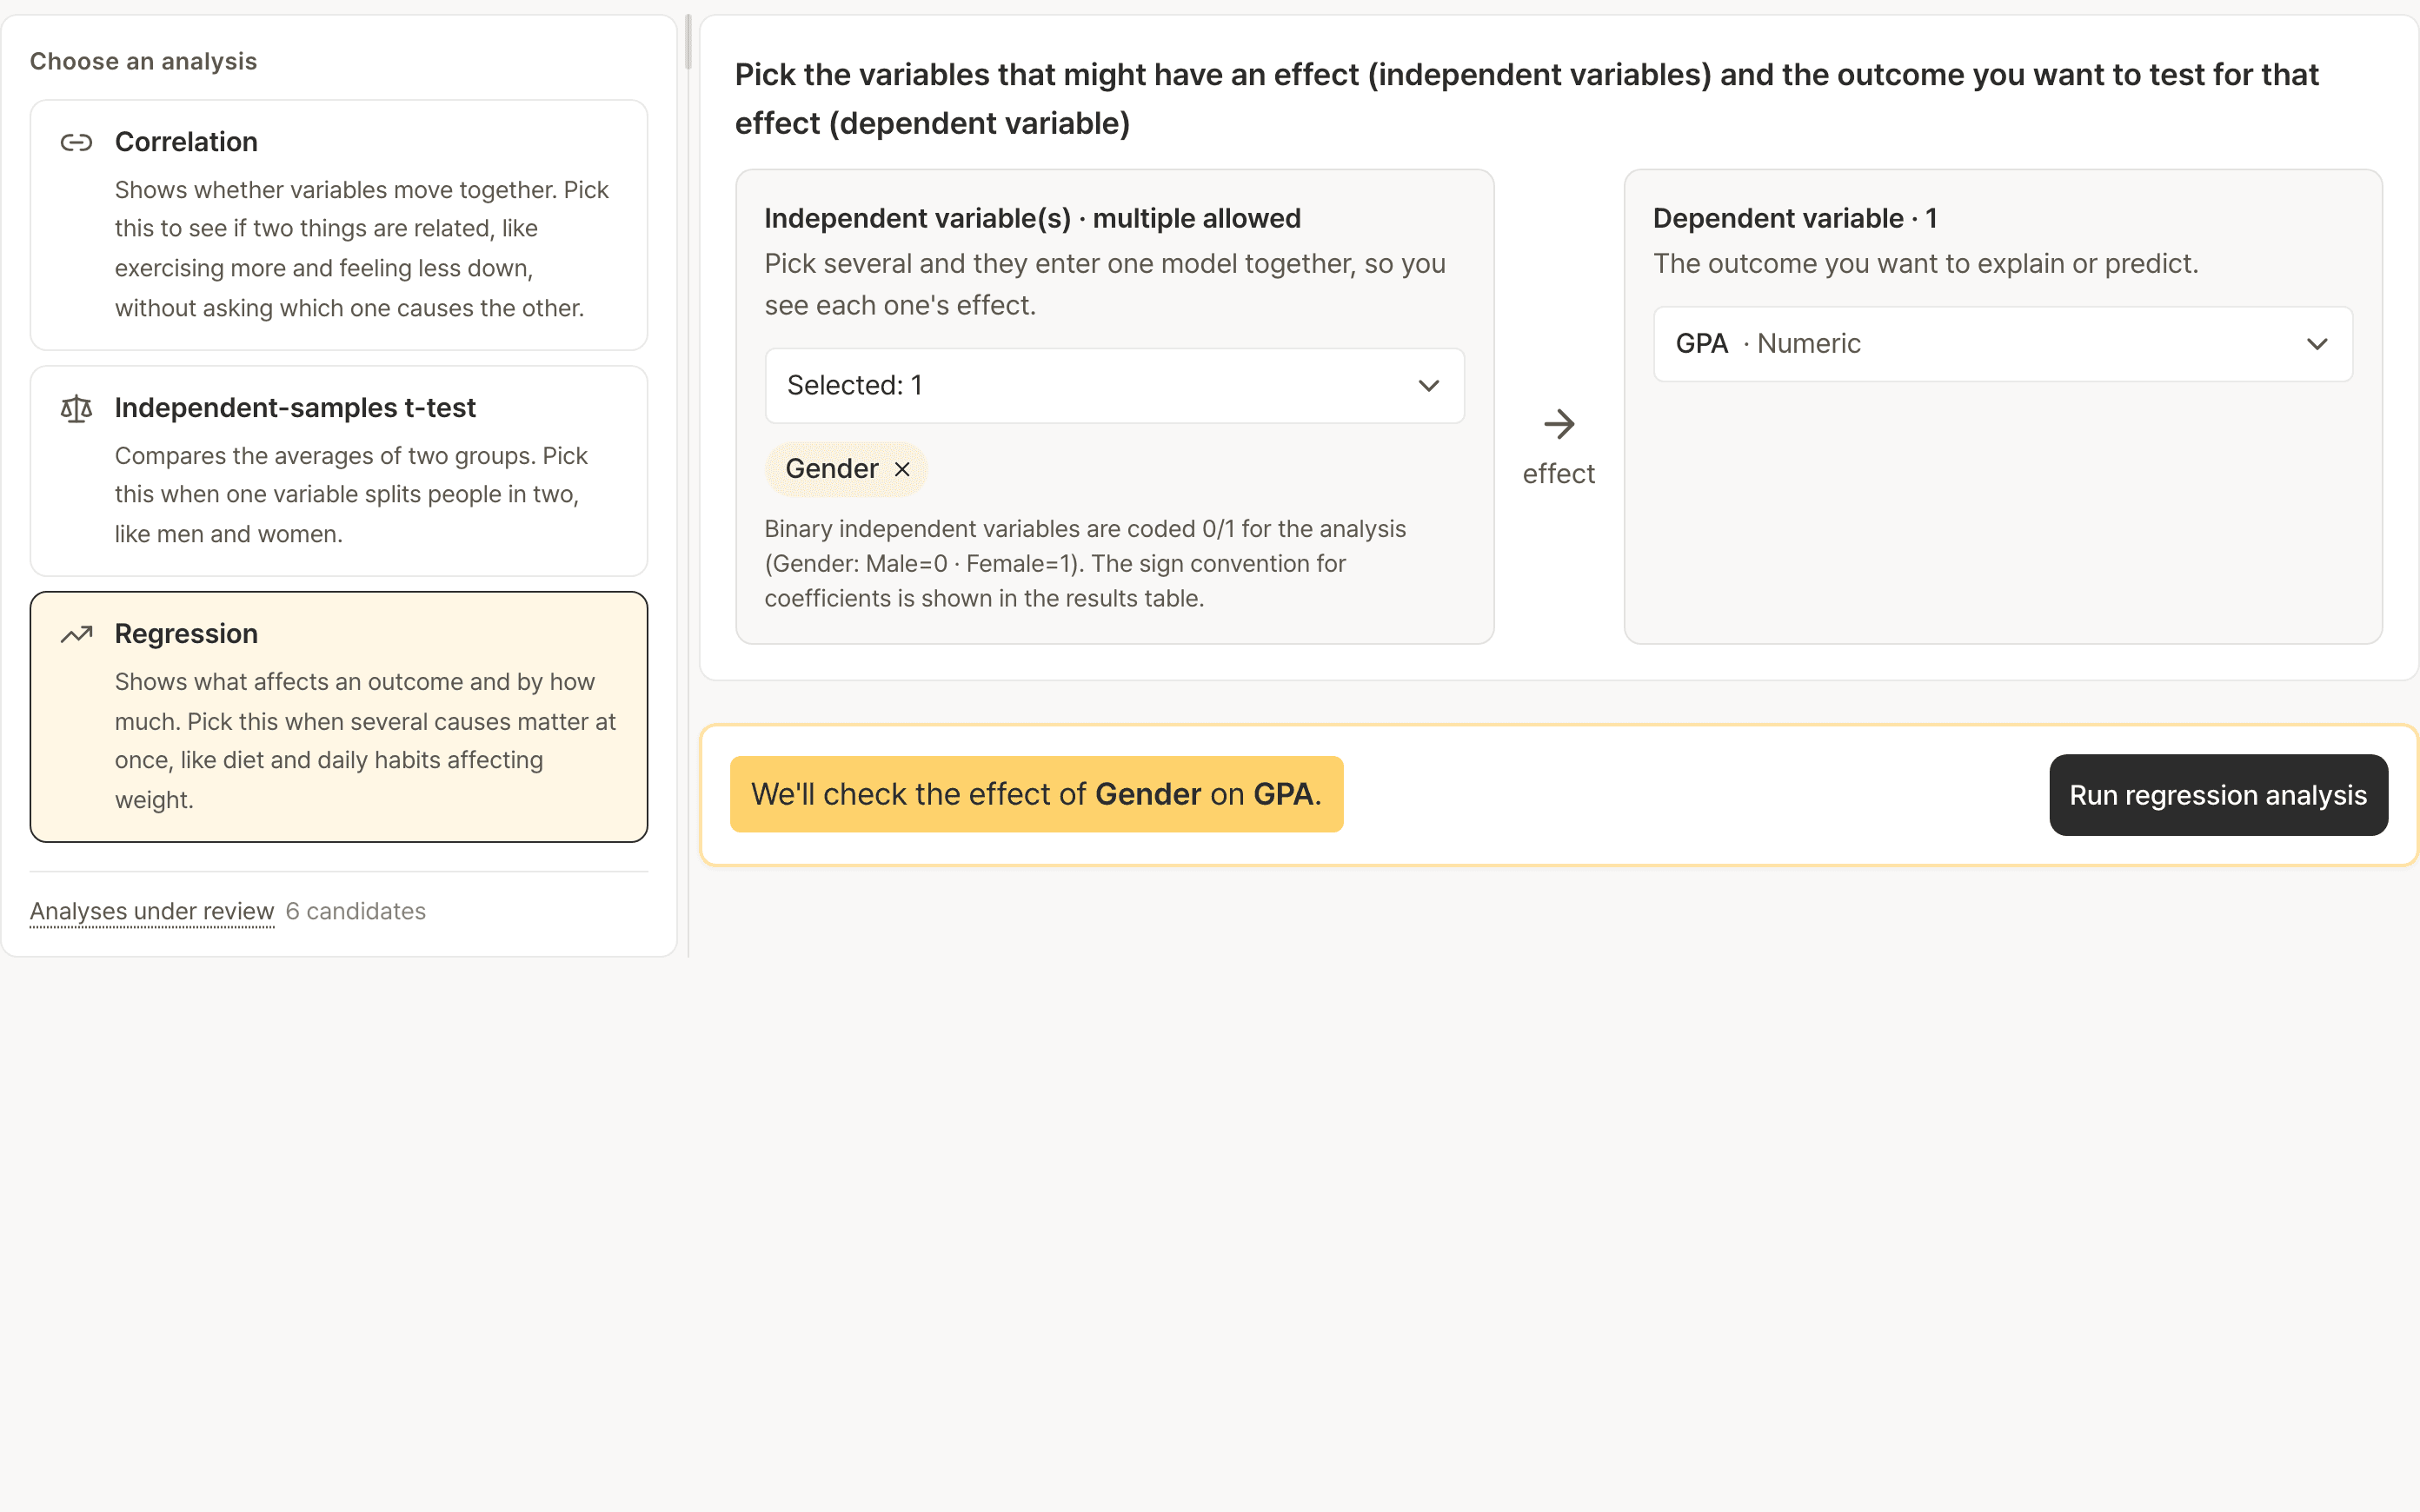
See which variables have missing values, and where. Pick how to handle them and the data is cleaned
Exclude responses with missing values from the analysis, or fill them with the mean. Pick a method and see how the responses change.
Try every feature free with your own data
Try the whole workflow for free, and pay once, only when you need final results for your full dataset.
Outsourced analysis
Hundreds of thousands of won · 3 days to 2 weeks
You get results tables and write-ups. Detailed interpretation and data cleaning can cost extra.
Private tutoring
₩60,000–100,000 an hour · 4–5 hours a day
You work through the analysis together for a day, on the tutor's schedule. Longer sessions cost more.
research79
All features and 80%-sample results, free
Pay ₩49,000 per dataset only when you need results on the full sample. Analyze your own data whenever it suits you, and get interpretations, APA tables, and sentences for your paper.
Outsourcing and tutoring figures reflect prices published online as of September 2026.
Whenever something's difficult, reach out to the research79 team


If you get stuck or something's unclear while using the service, just ask — the research79 team reads every question personally and replies.
We built research79 after seeing grad-student friends struggle with statistical analysis and wanting to help. We hope it means less wandering and more time saved, so you can spend that valuable time producing good research results.
How are the statistical test values calculated?
- All statistical values are calculated by R, the standard statistics program. They are not estimates or generative-AI output — the same data always gives the same result.
- We don't use generative AI for statistical tests. The same data always gives the same result.
- Test selection and analysis follow practices widely used in social science research, and we provide the supporting literature.
Frequently asked questions
Do I need to know statistics in advance?+
Not in advance. You'll choose whether to look at relationships, differences, or effects, and we'll explain the available tests and key results for your data in plain language.
What files can I upload?+
CSV or Excel (.xlsx/.xls) files up to 10MB. Any file where each row is one respondent works — for example, an export downloaded from Google Forms.
How do I know whether my analysis is supported?+
You can check directly, using the sample data and the 80% preview.
Are the results accurate?+
All numerical results are calculated by the statistical engine R, with no arbitrary estimation. Core outputs are verified against standard statistical tools such as SPSS and jamovi, and are ready to use in your paper.
What do I write in the methods section about the analysis tool?+
All values are calculated in R, the standard statistics program. The cleaning steps applied to your analysis — missing values, outliers, reverse scoring — are listed on the results screen, so you can reference them when writing your methods section.
Is my data safe?+
We remove personally identifying information during upload, and don't store it permanently.
Can I ask questions if I get stuck?+
Yes. If you get stuck during upload, data cleaning, test selection, or the results screen, you can leave a question. The research79 team reviews it directly and usually replies within a day.